With the Q4FY25 results season underway, investors are closely monitoring corporate performance to gauge further market direction. The week began on a positive note, extending the bullish momentum from the previous week. However, the last two trading sessions witnessed some headwinds, leading to heightened volatility. Despite this, the Nifty 50 managed to close the week with a gain of 0.79%.
In the commodities segment, gold continued its upward trajectory and came close to the Rs 1 lakh mark but fell short of touching it. The rally in precious metals reflects global uncertainties and a growing investor preference for safe-haven assets.
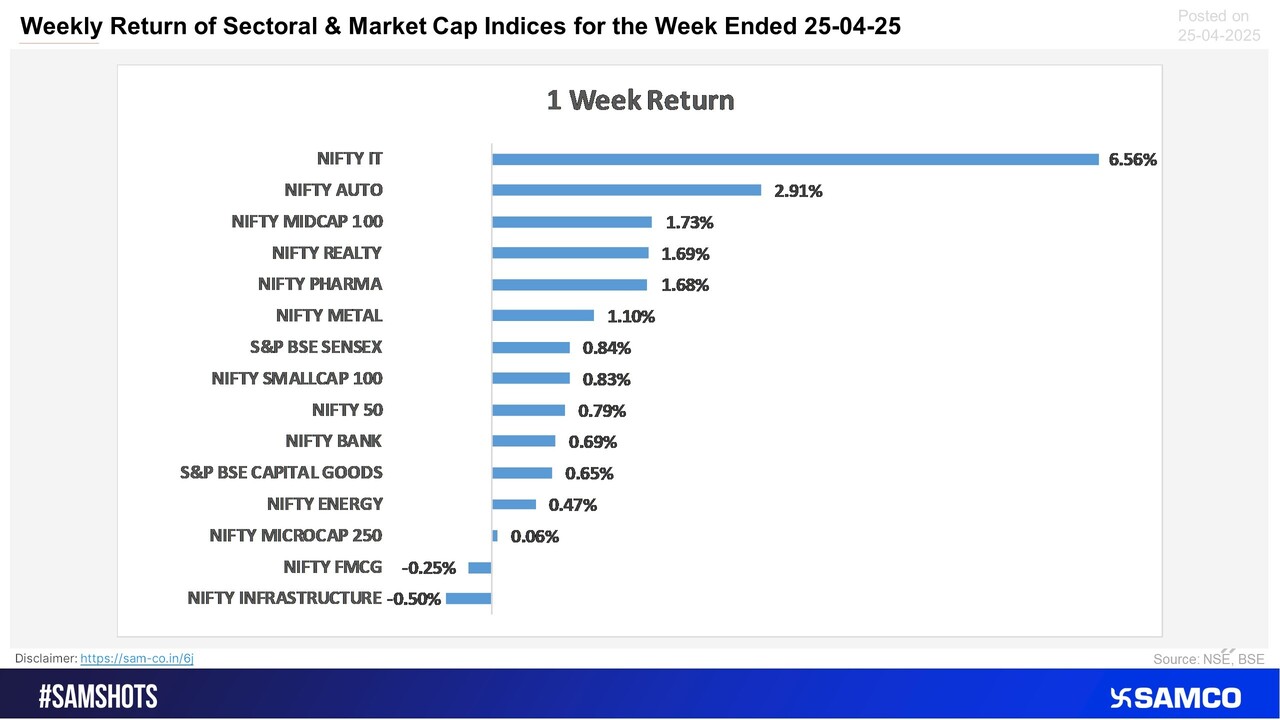
Sector-wise, the IT sector drew significant investor attention. The Nifty IT index staged a strong comeback, surging 6.56% during the week after a period of weakness. The sharp rebound indicates renewed optimism around earnings resilience and potential recovery in global tech spending.
Scroll down to understand more of such market news and perspectives for the week gone by in easily understandable charts.
The Q4FY25 performance of AU Small Finance Bank impressed investors, leading to a sharp rise in its share price


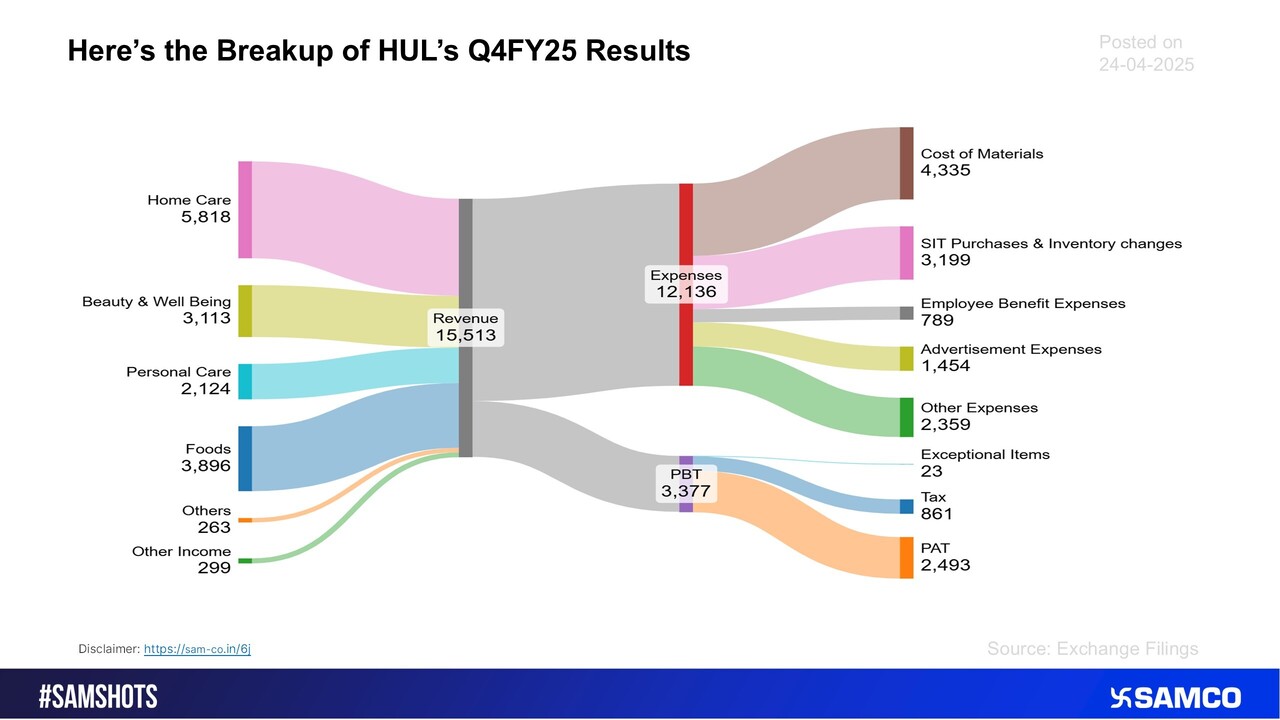
This is how HUL earned in Q4FY25.
Block-buster results of Waaree Entergies and solid future outlook led share price surge. Results are outlined below
_ep179.jpg)
The below chart shows the performance of HDFC bank in Q4FY25.

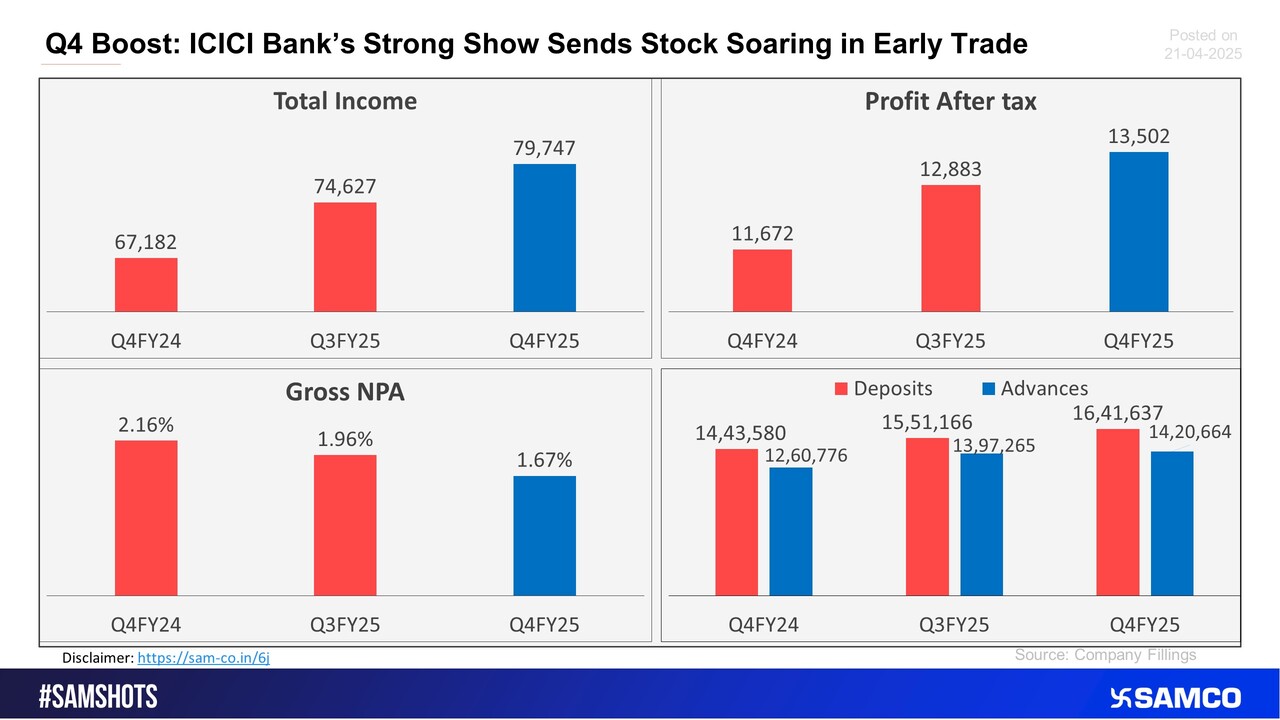
Here’s how ICICI bank performed in Q4FY25
The shares of Axis bank tumbled 5% post Q4FY25 results.

Below is the performance of HCL in the Quarter ending 31st Mar 2025.

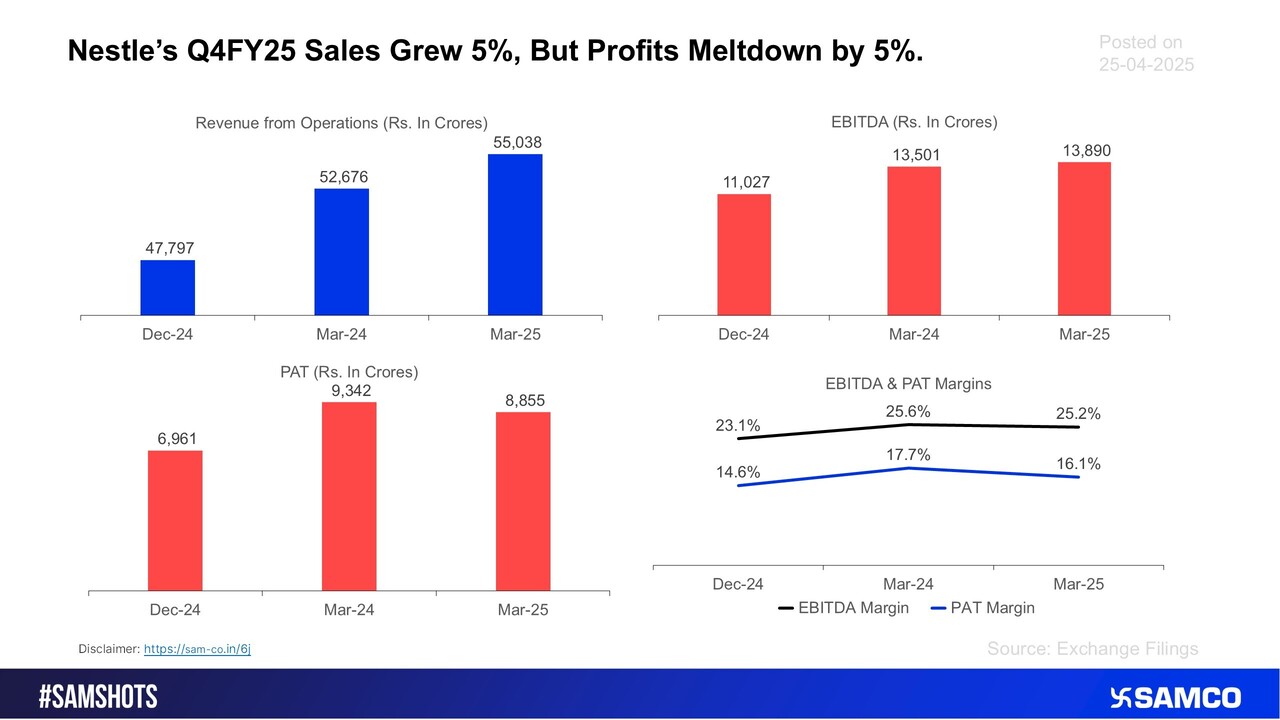
The accompanying chart presents the Nestle’s 4th Quarter performance.
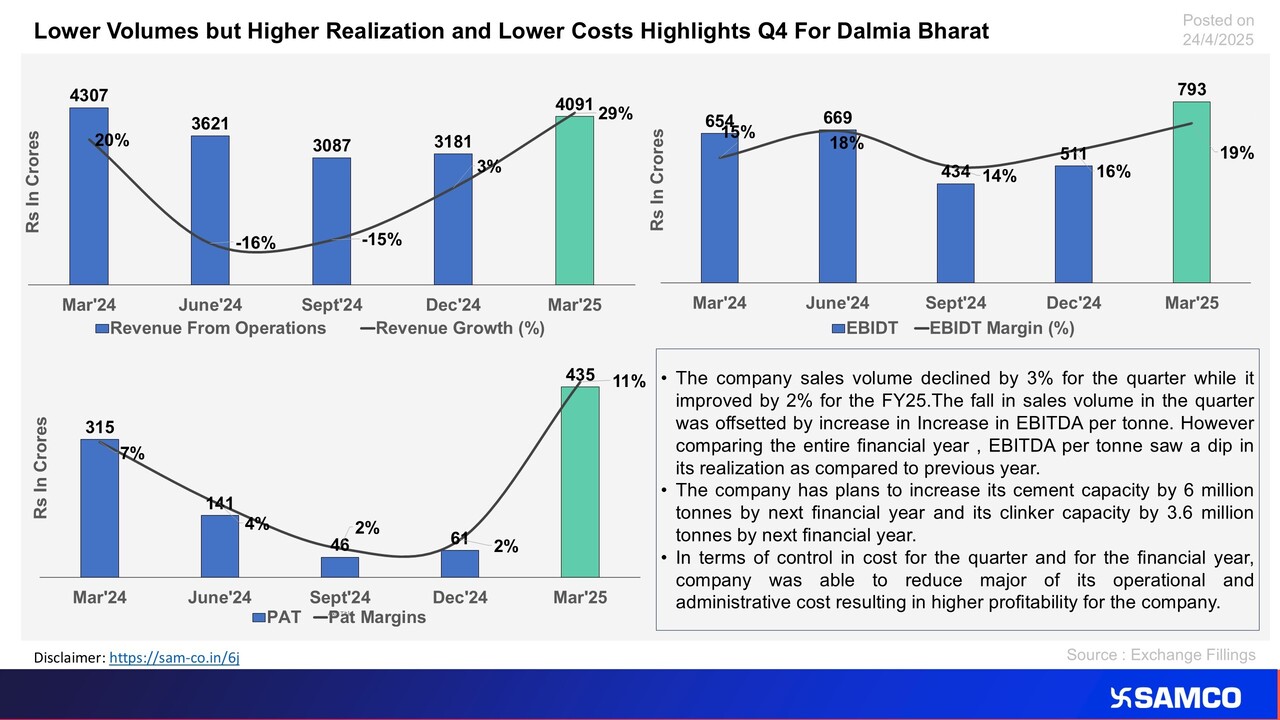
The chart displays the financial performance of Dalmia Bharat for Q4FY25
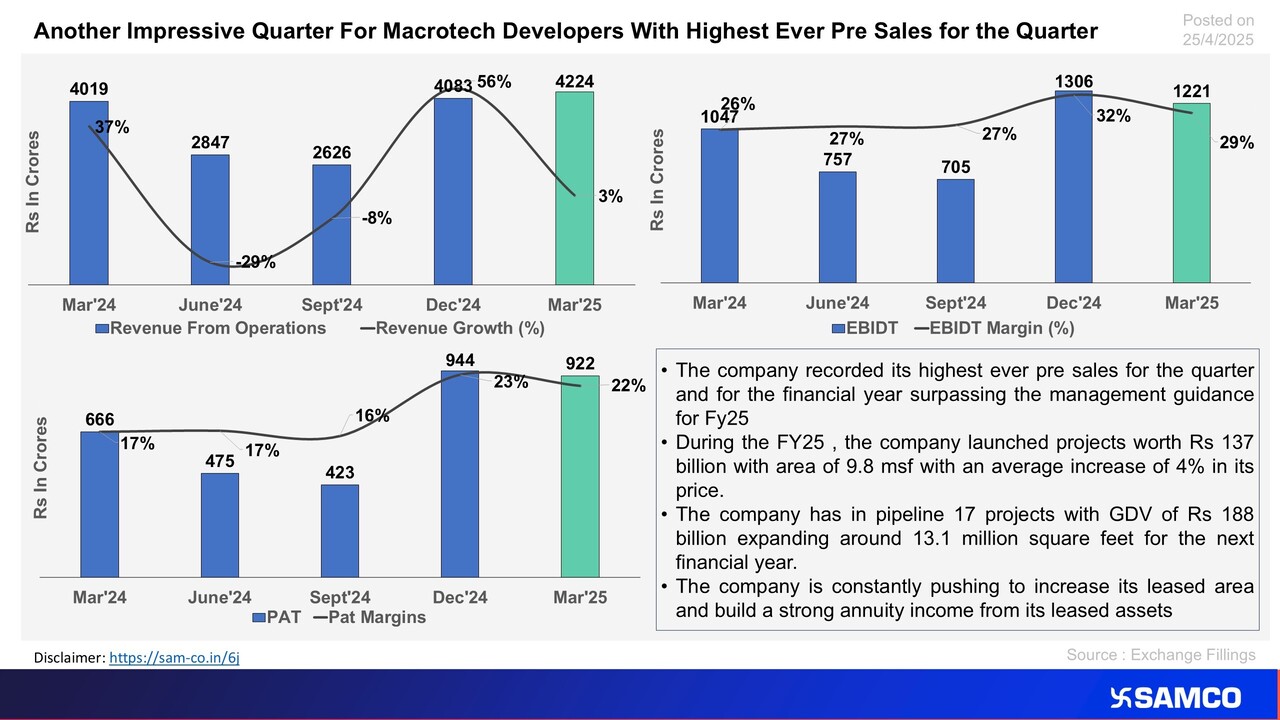
Another Highest Ever Pre Sales Recorded by Macrotech Developers for Q4Fy25
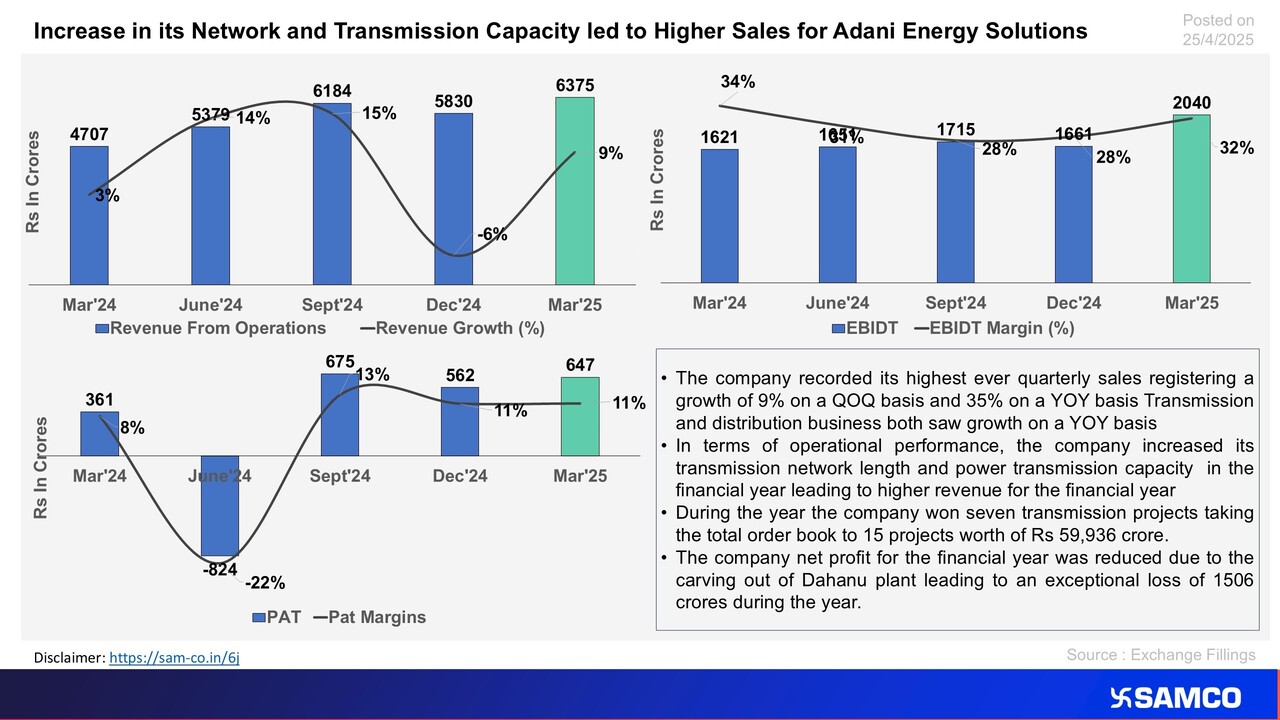
Exceptional loss reduced profits of Adani Energy Solutions which otherwise witness rise in its operational and financial parameters
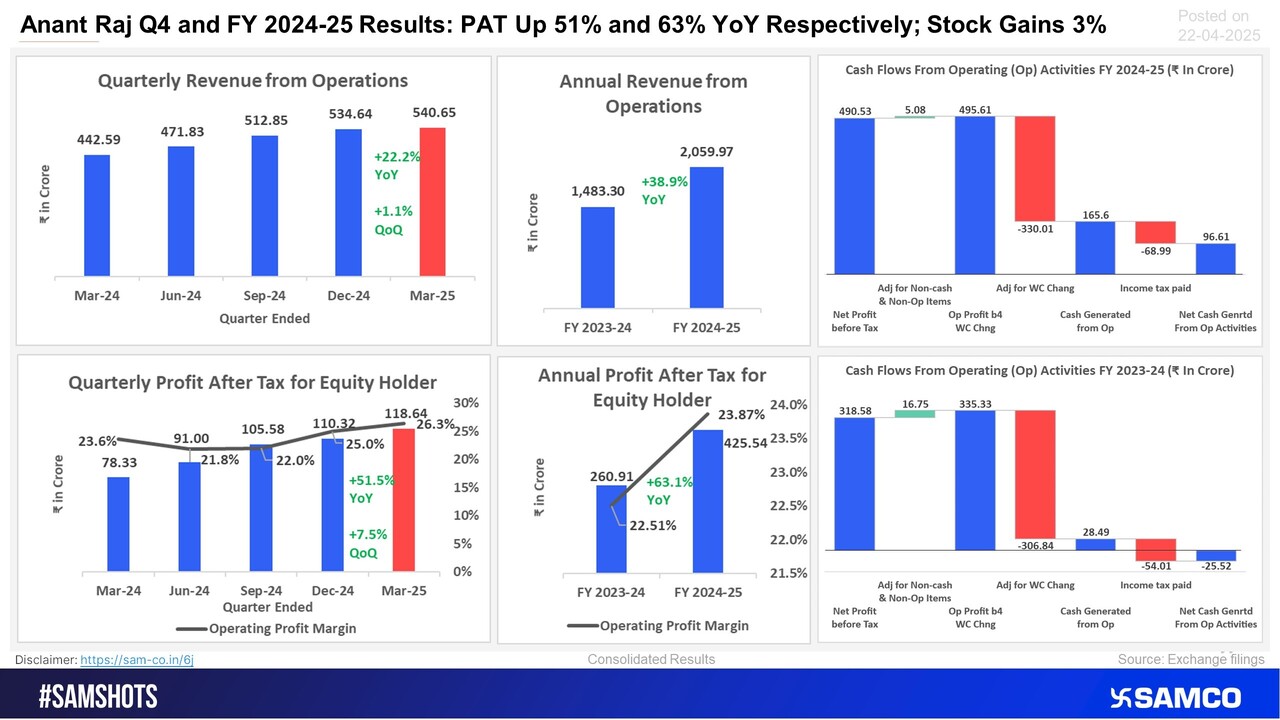
Highlights of Anant Raj’s quarterly and annual performance is presented below
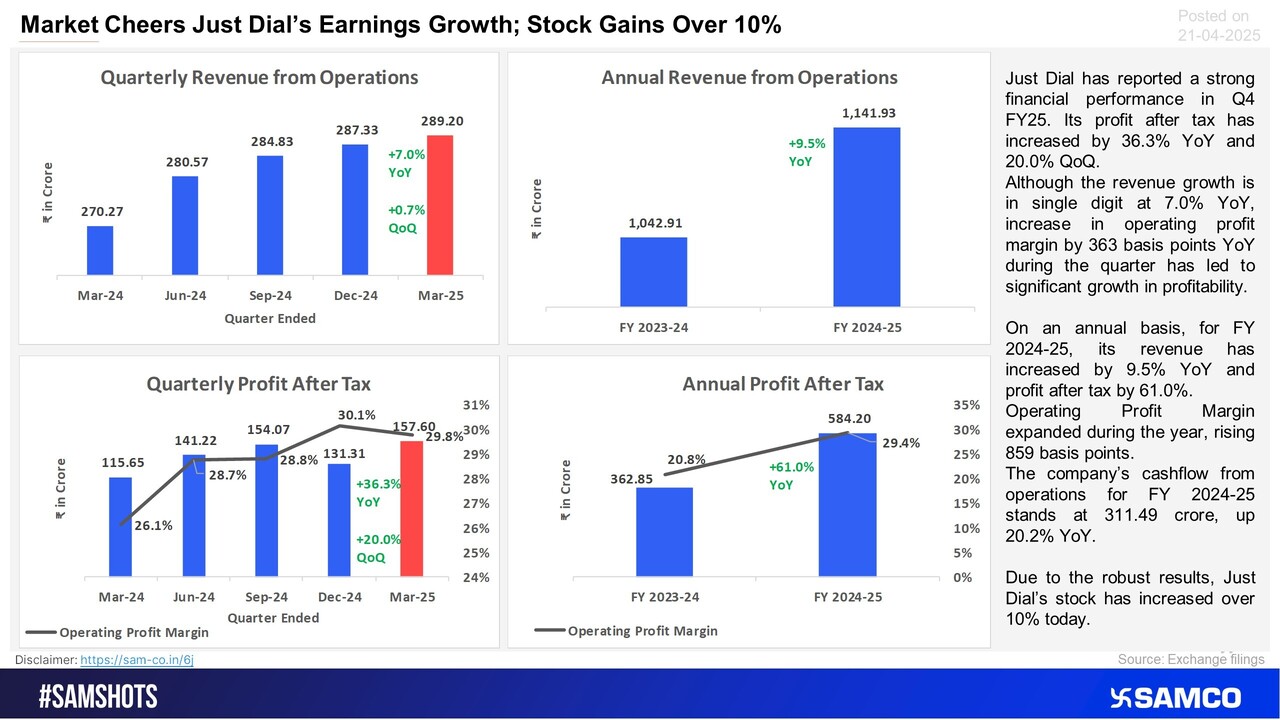
Just Dial achieves operation efficiencies, margin expansion drives the profit growth, here’s a closer look.
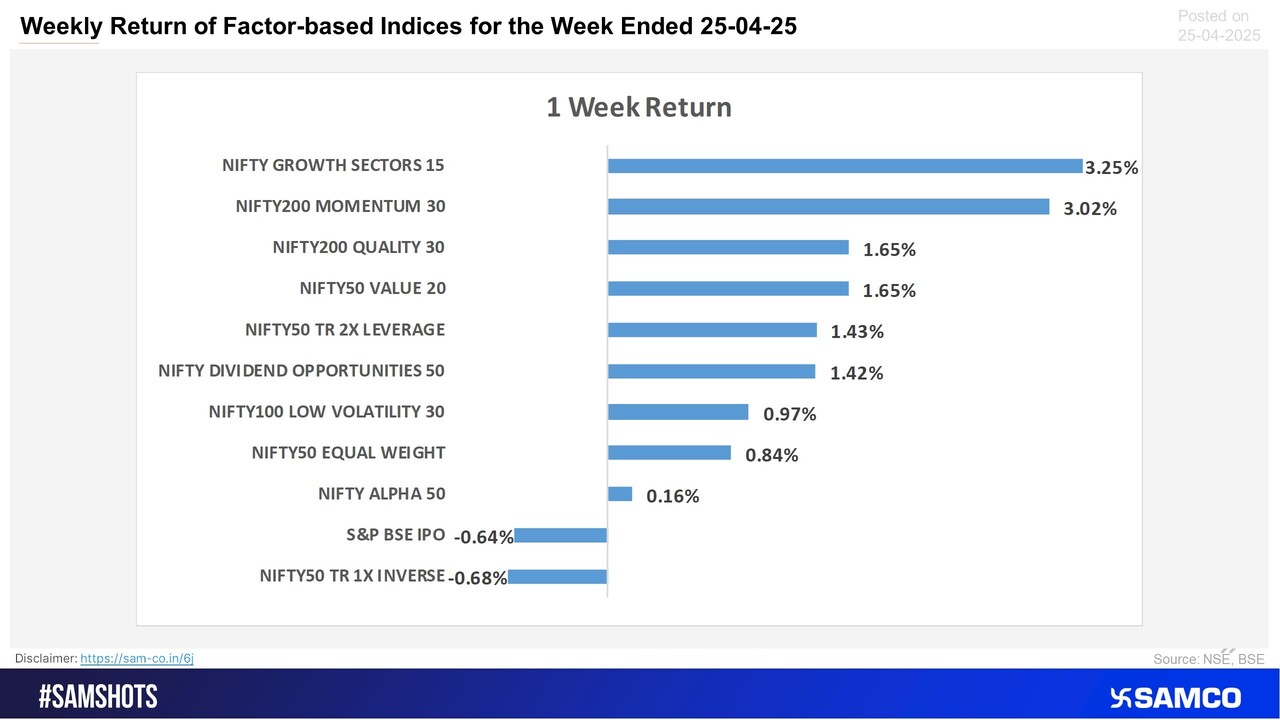
Growth and Momentum factors outperformed this week, while IPO strategy index lagged
IT sector has performed this week, witnessing a bounce back from the low
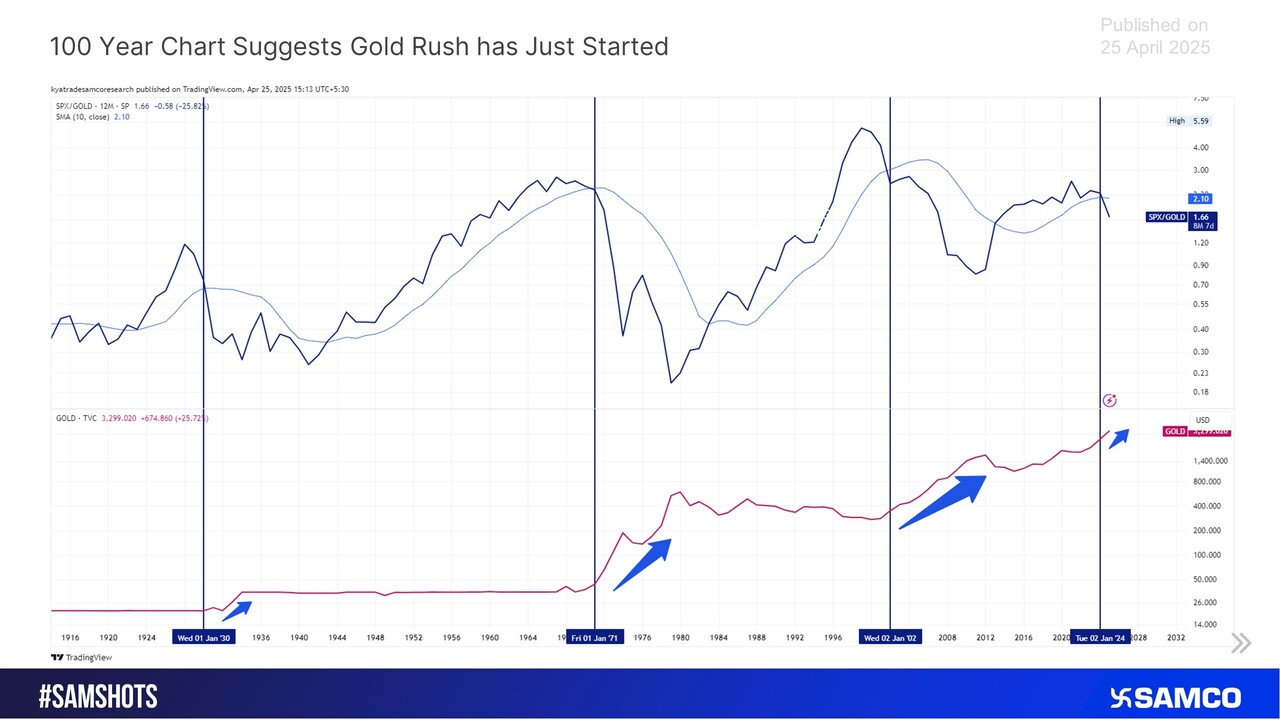
100 Year Chart Suggests Gold Rush has Just Started
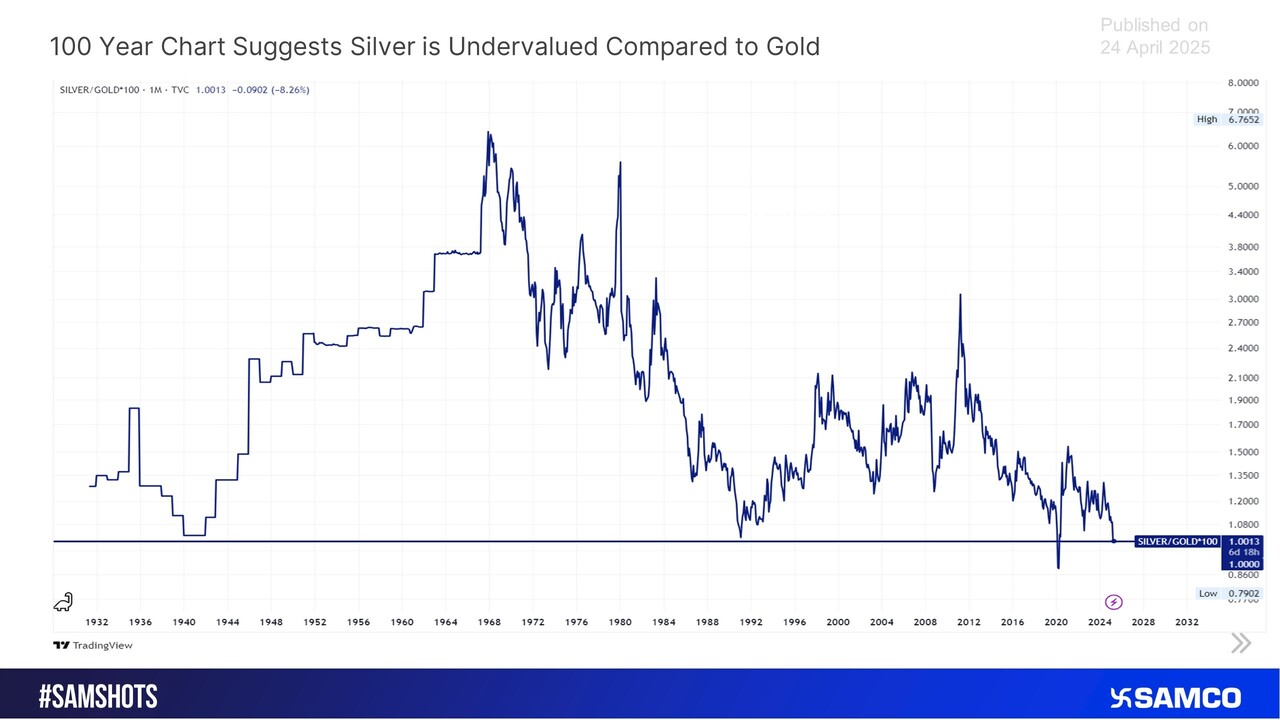
100 Year Chart Suggests Silver is Undervalued Compared to Gold
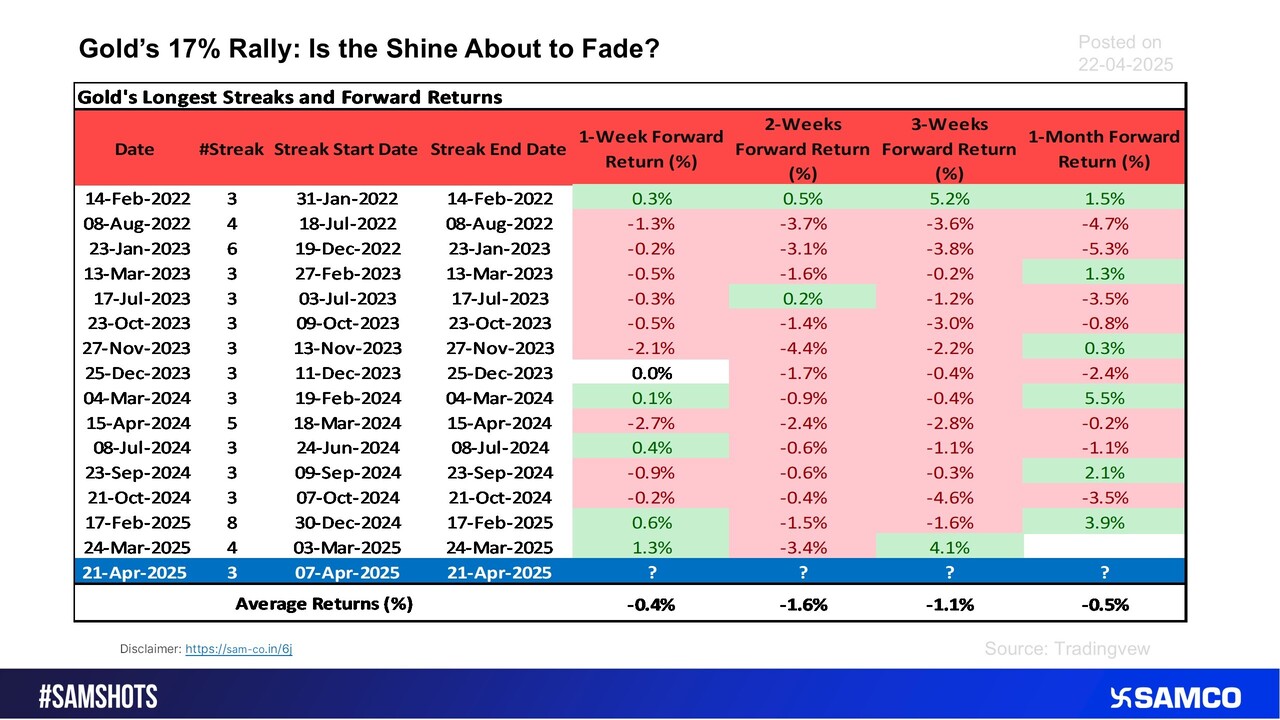
Here’s how gold performance stood post rallying continuously.
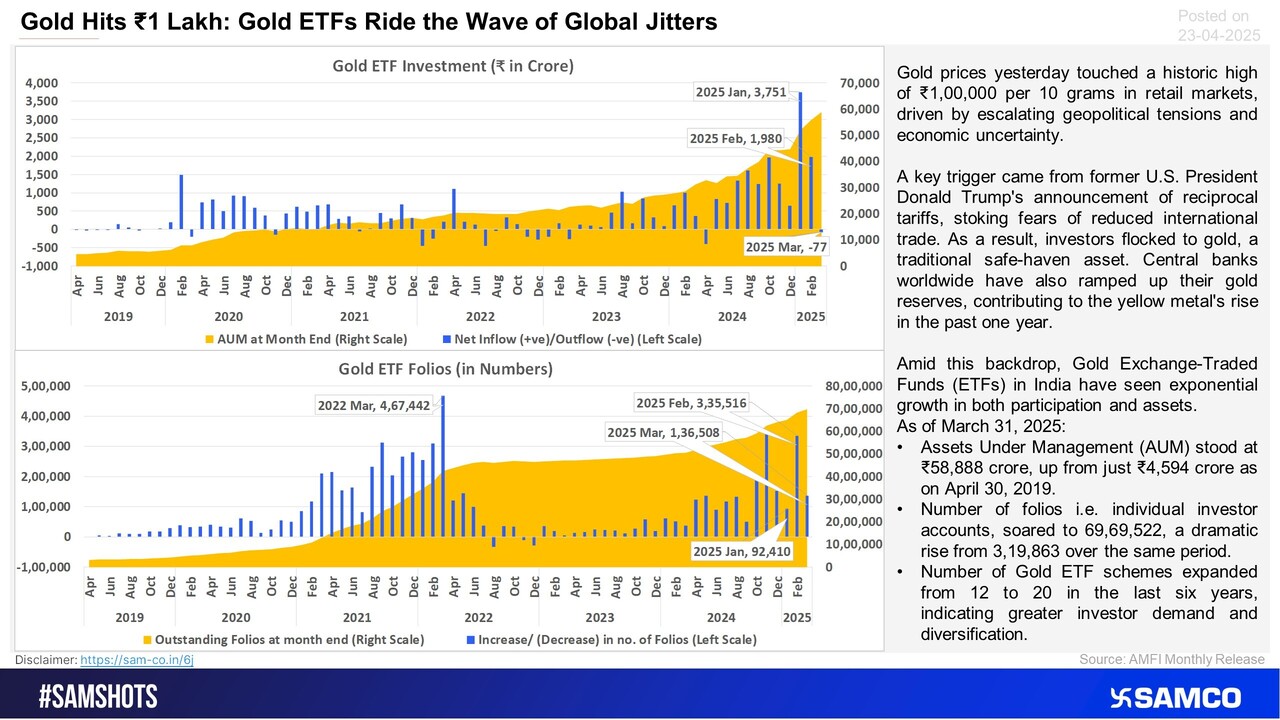
As Gold retail price hits ?1 lakhs, Gold ETFs’ progress journey in India is summarised here:
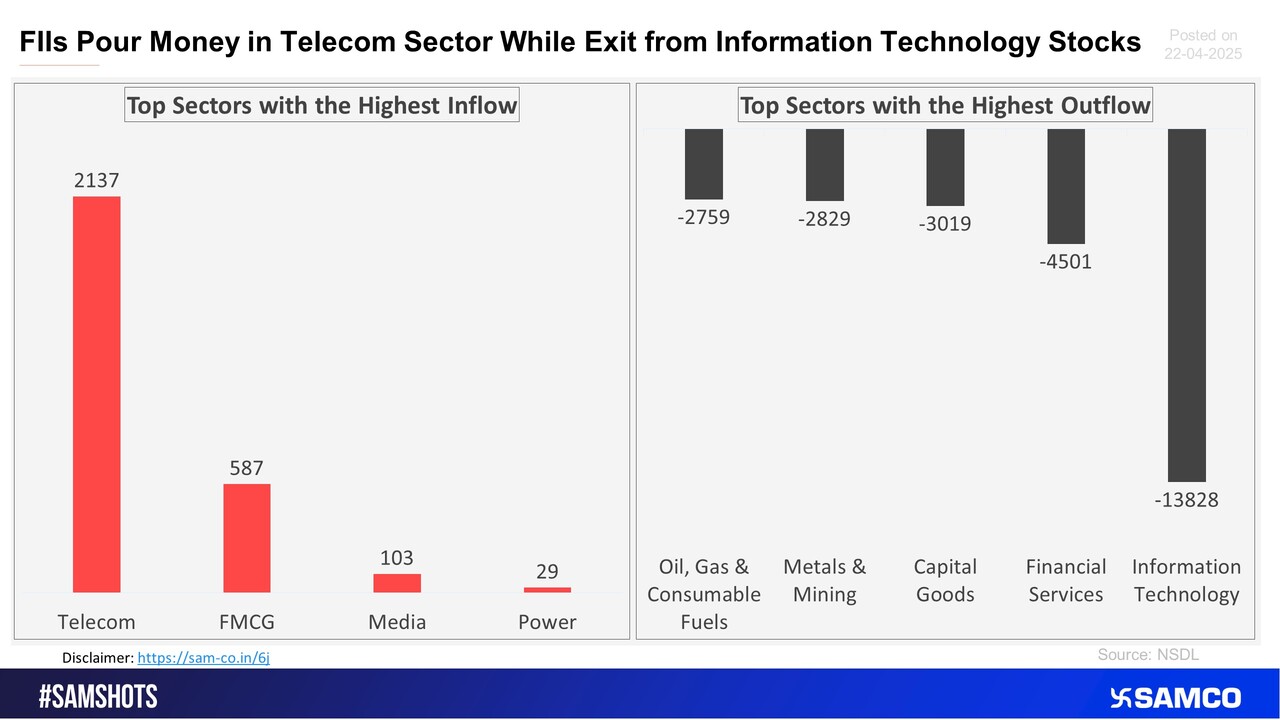
The accompanying chart shows the top sectors that witnessed FPI’s highest inflow and outflow in the latest quarter.
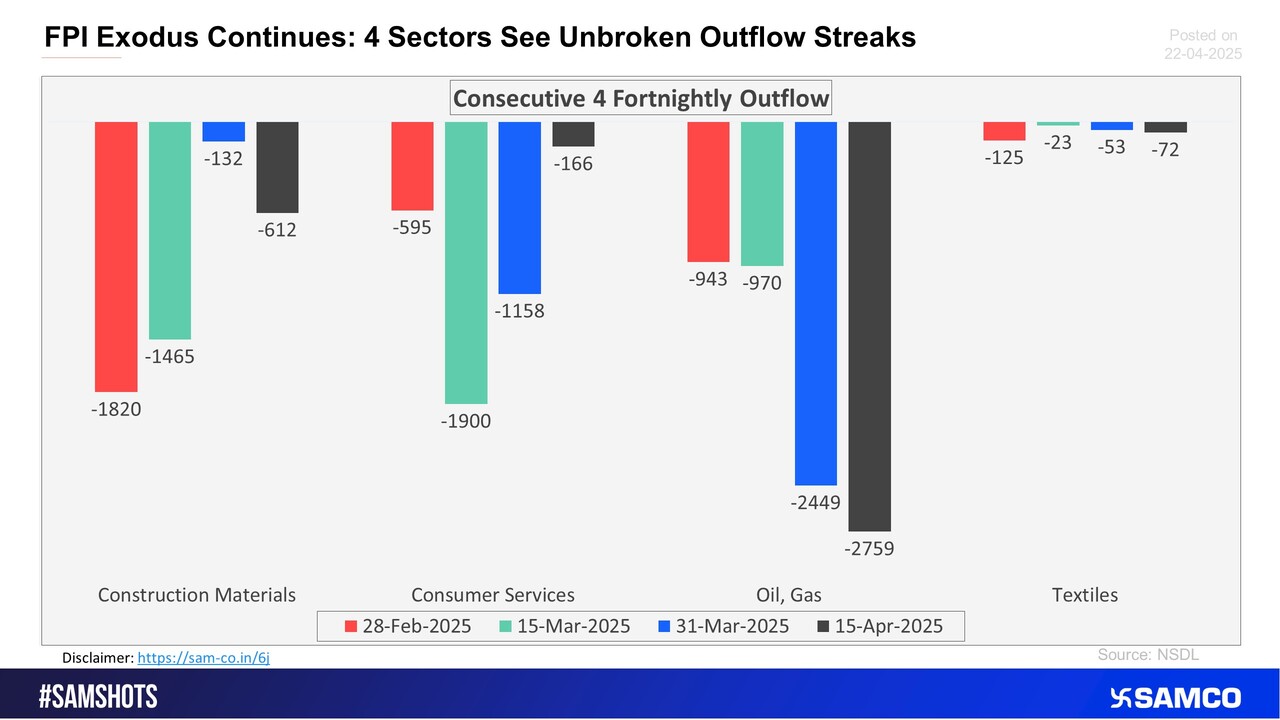
The sectors shown in the chart have witnessed consecutive 4 fortnightly outflows of FPI money
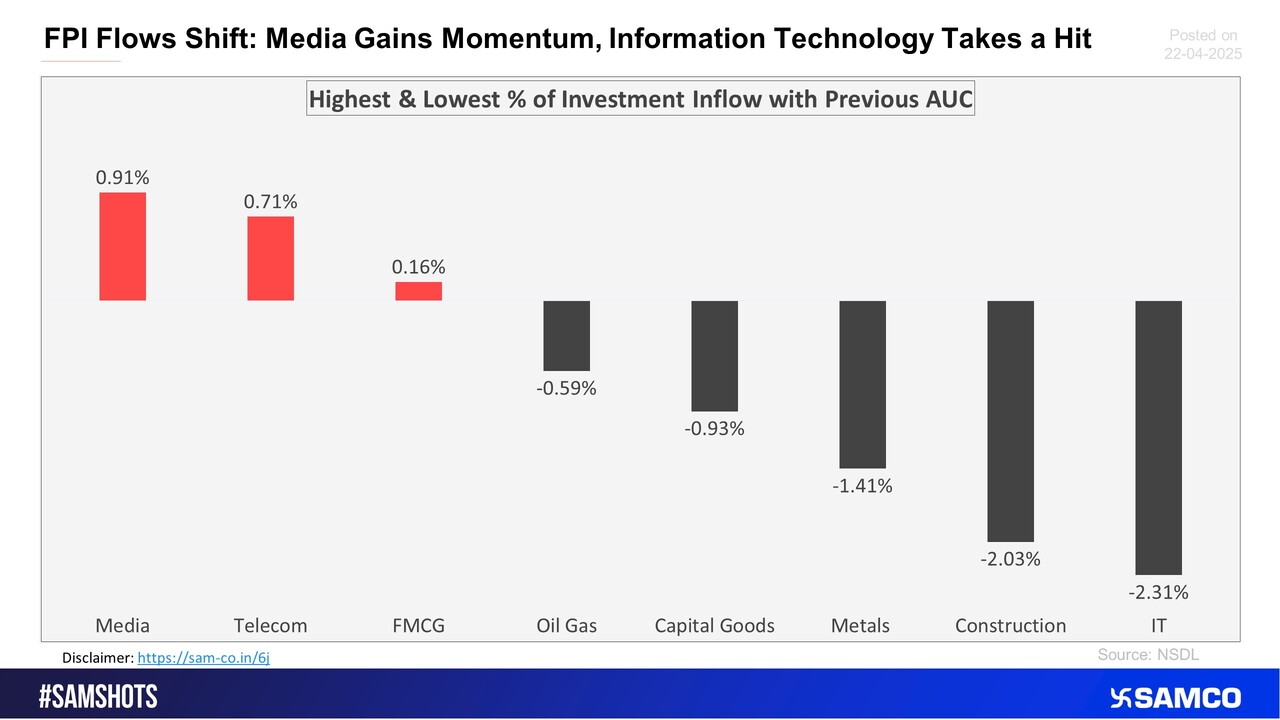
The below chart presents the highest & lowest percentage inflow of investment in the latest fortnight compared to the previous period AUC (Asset Under Custody) of FPI.
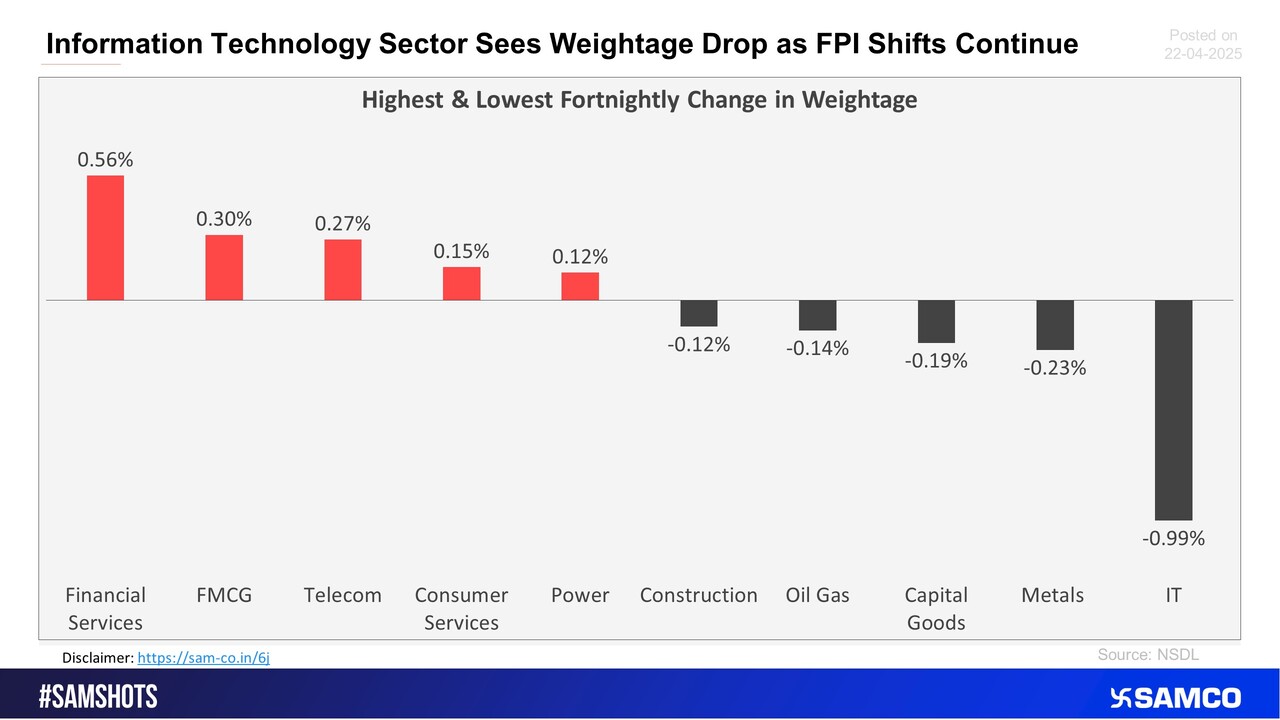
The chart below displays sectors that witnessed the highest and lowest change in the weightage of sectoral FPI holdings to the total FPI holdings compared to the previous fortnight
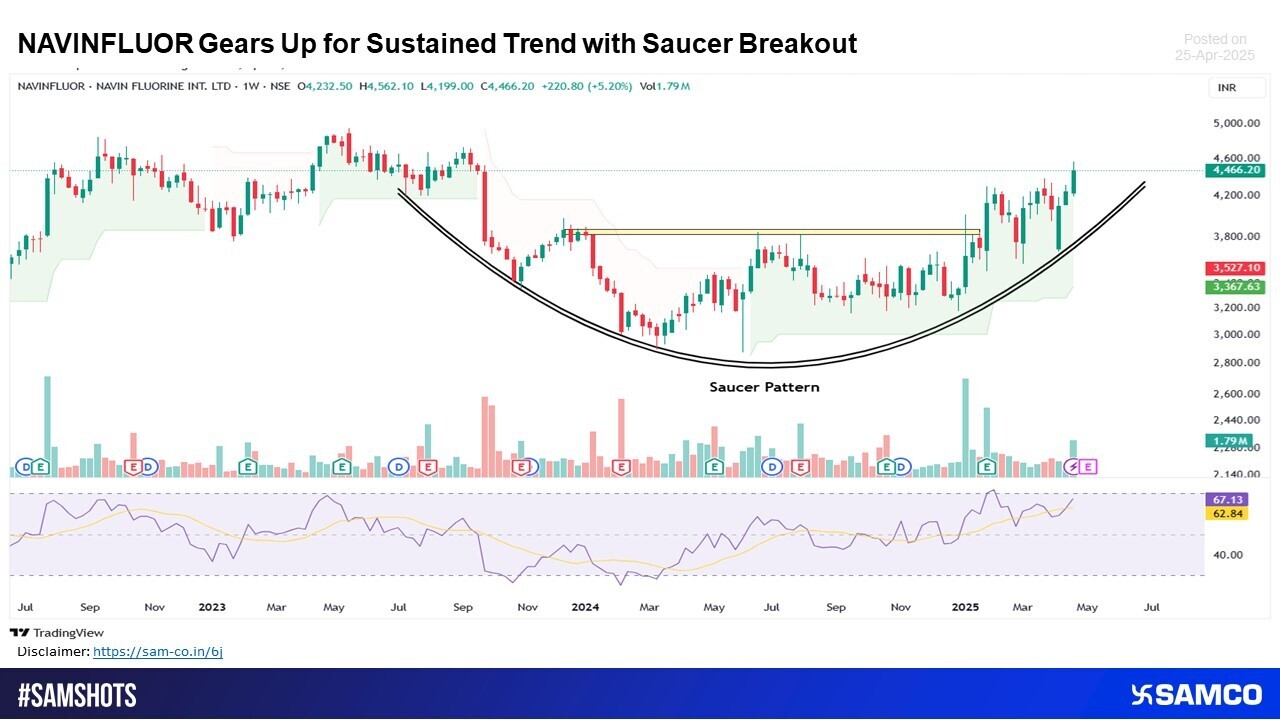
NAVINFLUOR Builds Momentum with Strong Weekly Breakout
NIFTYBEES Near Support? EMA Signal Points to Accumulation Phase
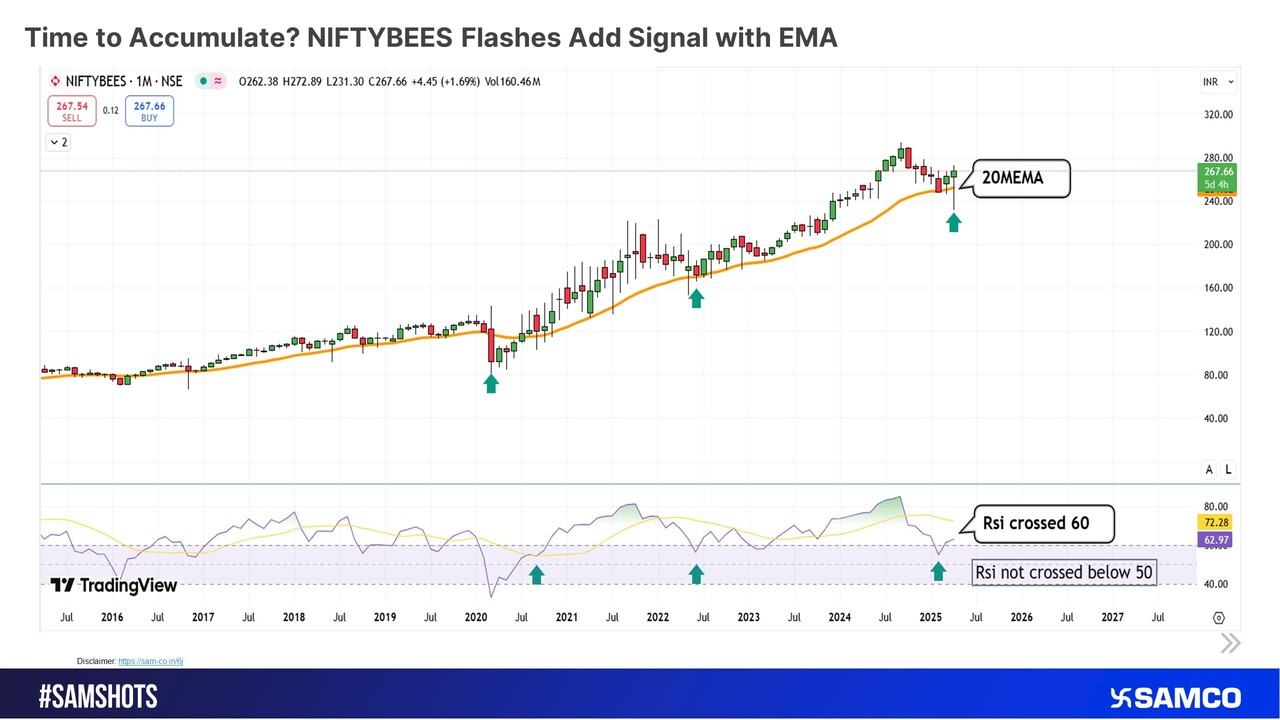
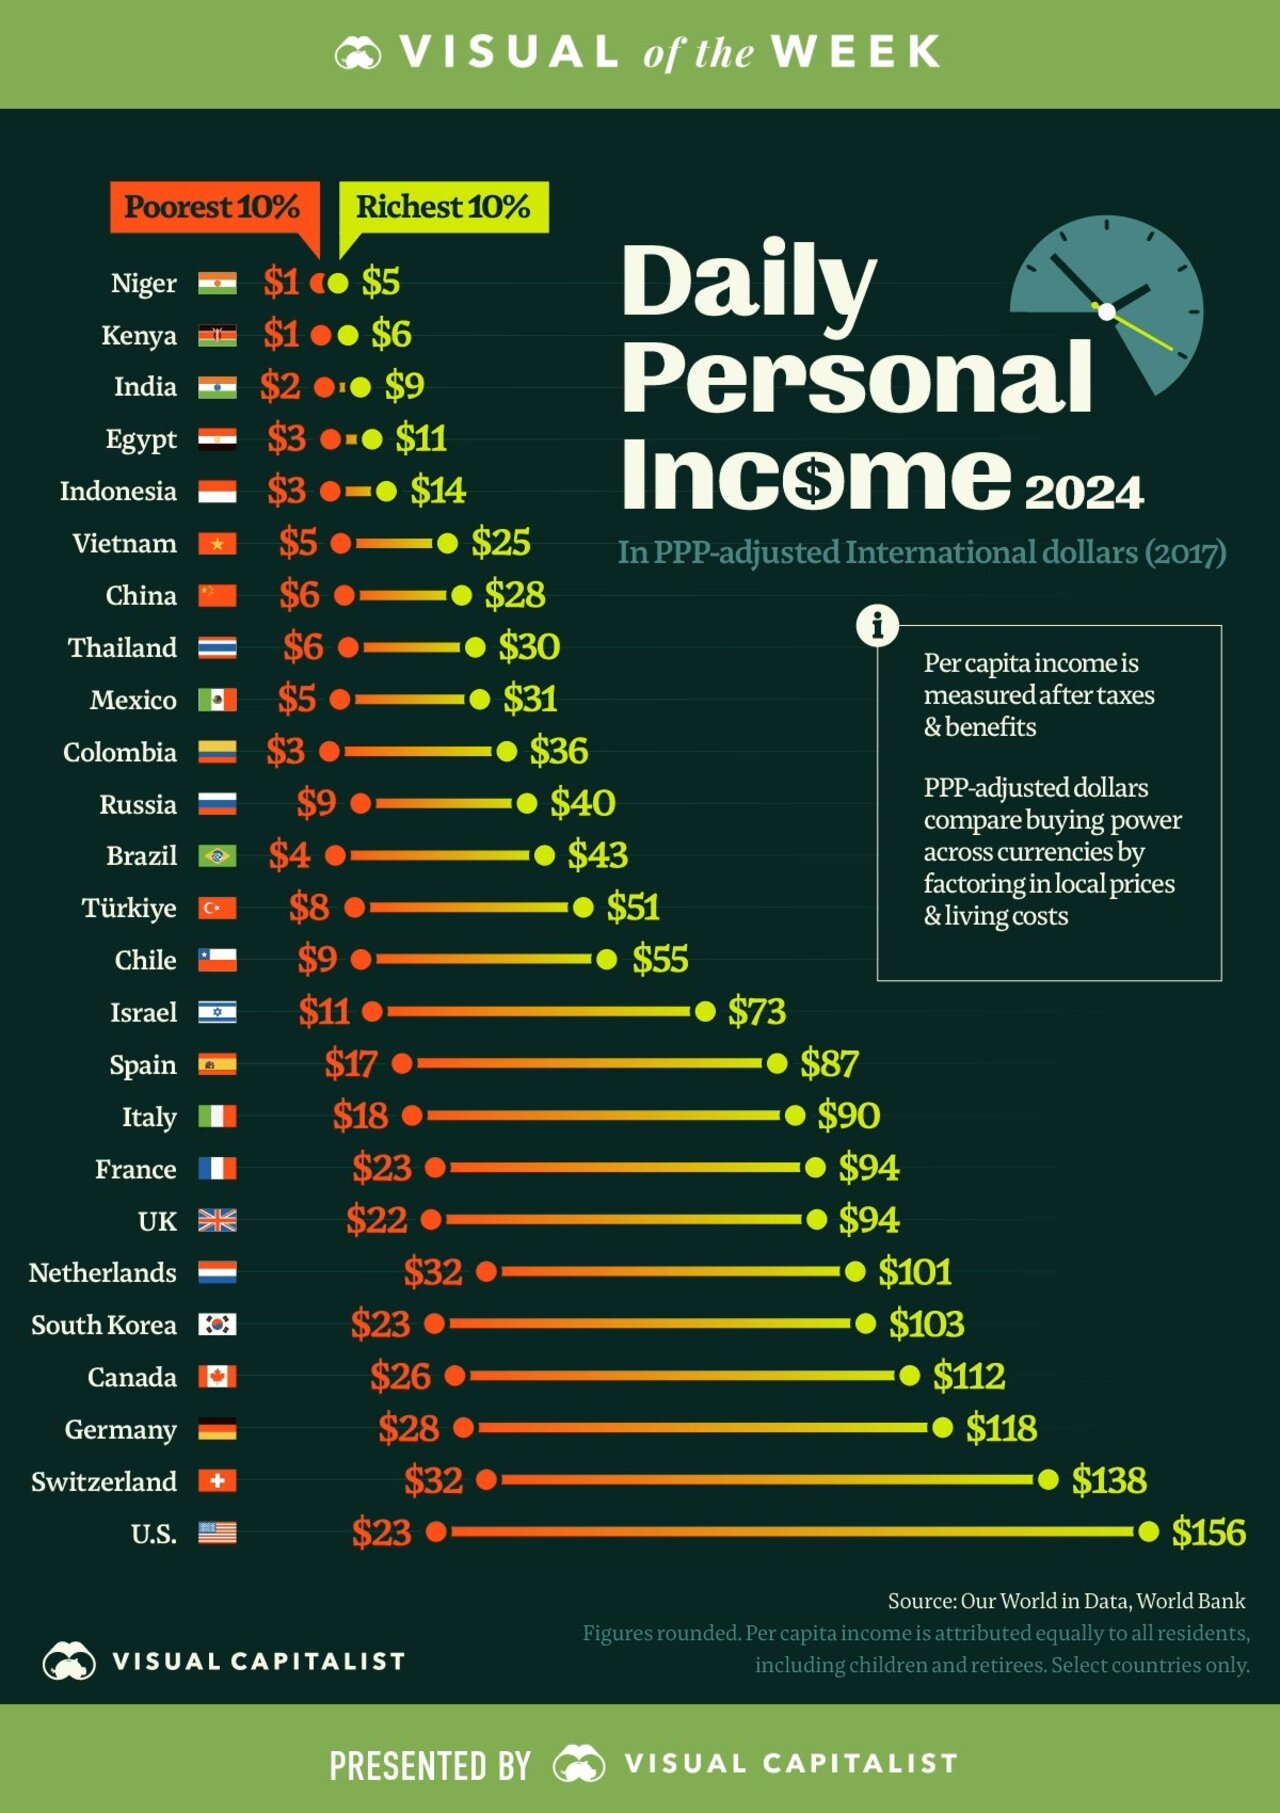
Image Source: @VisualCap (Twitter)


 Easy & quick
1. Register on SCORES portal
2. Mandatory details for filling complaints on SCORES
Name | PAN | Address | Mobile | Number | E-mail ID
3. Benefits
Effective Communication
Speedy redressal of the grievances
