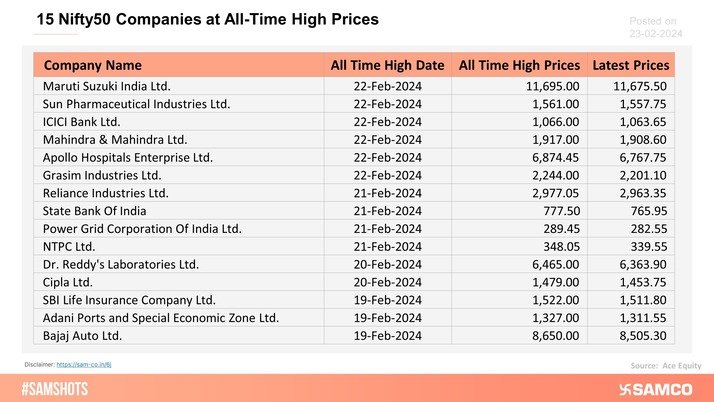
The Nifty 50 index has been on an absolute tear during this week, smashing all-time highs not just once, but a whopping five times in a row. And it's not just the index itself that's been breaking records – the week witnessed 15 stocks within the Nifty 50 touched their all-time high prices.
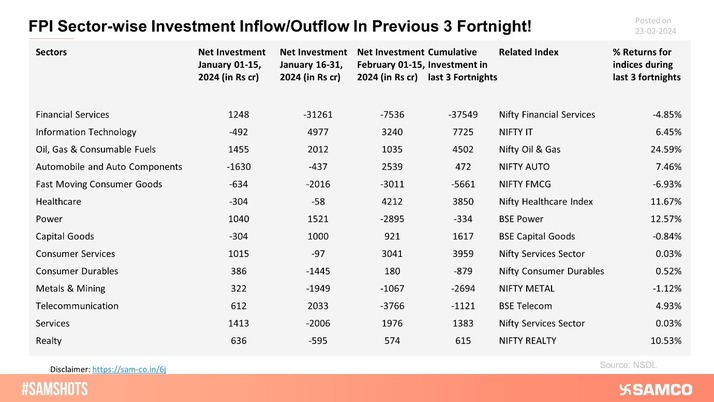
Taking a look at the cash flow from Foreign Portfolio Investors (FPIs) over the previous three fortnights in India, the financial services sector recorded a major outflow. On the flip side, a substantial chunk of investment flowed into the oil, gas, and information technology sectors.
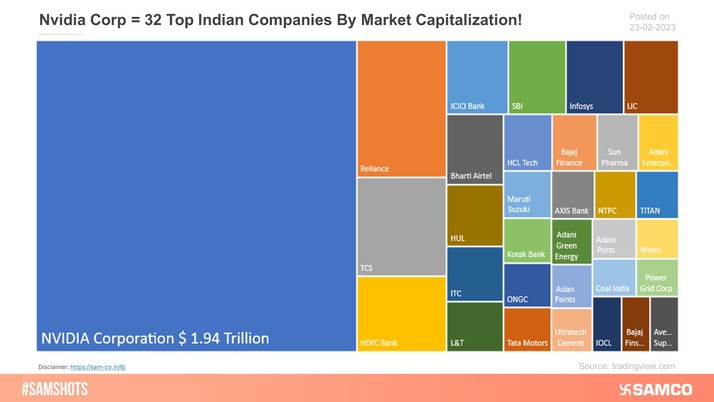
NVIDIA Corp, the US-based chip maker, sent shockwaves through the US market with a staggering 16% surge in its market capitalization in just one day. To put that into perspective, this single-day growth surpasses the market cap of even India's largest company, Reliance Industries. And if that wasn't mind-boggling enough, consider this: NVIDIA's total market cap stands equivalent to the combined market capitalization of the top 32 Indian companies.
Nifty ended the week 0.78% higher at 22,213. Nifty Realty and Nifty Auto surged the most during the week with a gain of 4.08% and 0.97% respectively.
Scroll down to understand more of such market news and perspectives for the week gone by in easily understandable charts.
The below infographic presents the comparison of NVIDIA Corp and top Indian Companies by Market Cap.


The table below shows a list of 15 stocks that have touched their all-time high prices this week.
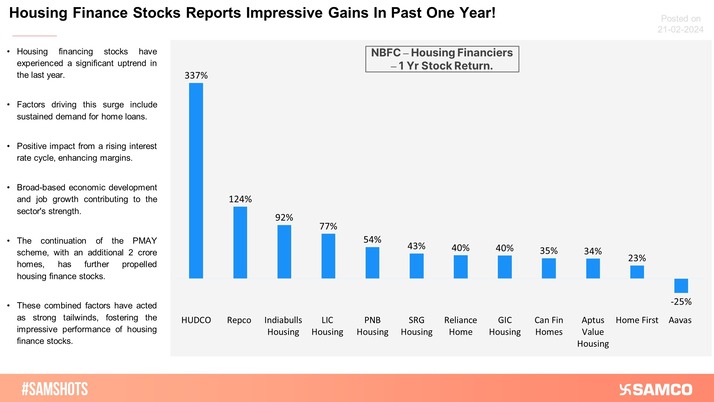
Key Reasons Why Housing Finance Stocks Have Enjoyed an Impressive One Year!
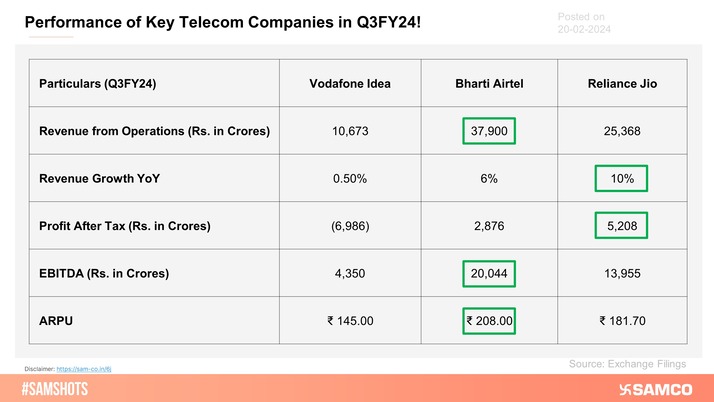
Here's How Key Telecom Companies Fared in Q3FY24!
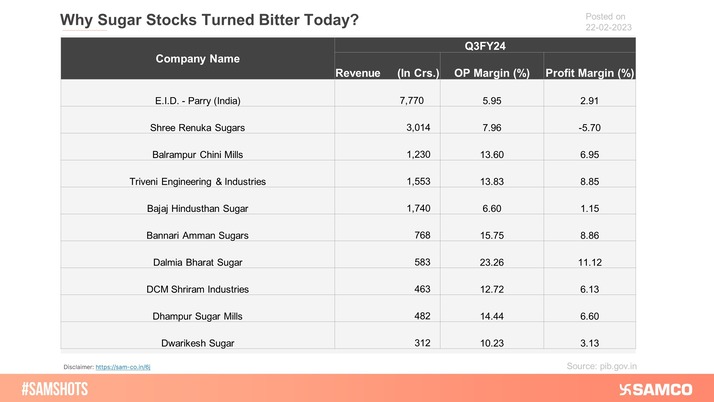
The reason behind the fall of sugar stocks on 22nd Feb-2024!
The chart below shows the Q3FY24 results of CRISIL.
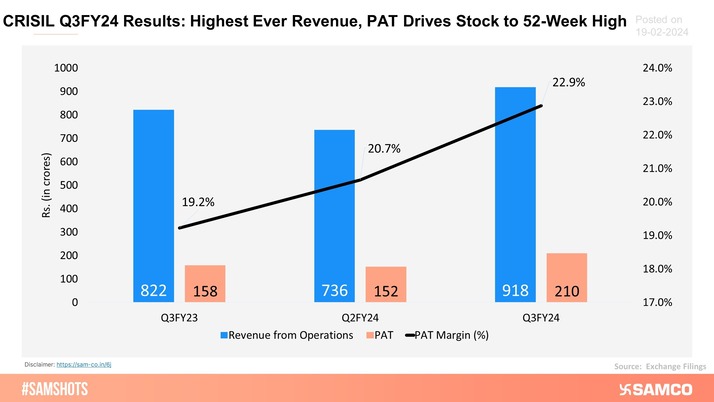
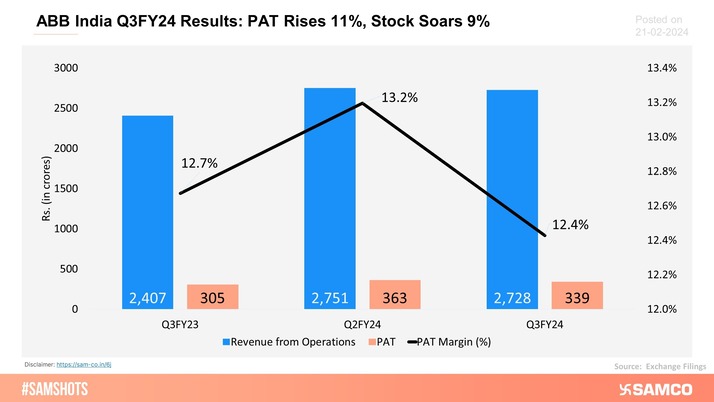
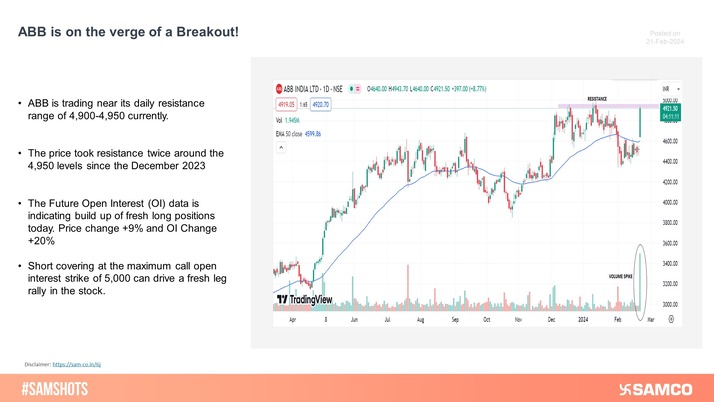
ABB India Ltd. posted a great set of Q3FY24 numbers.
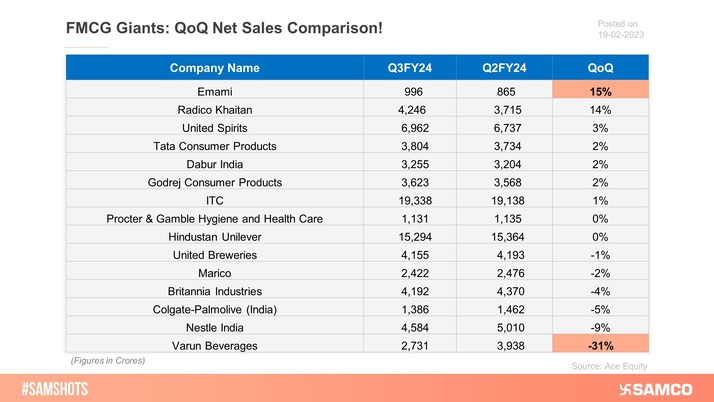
The laggards and leaders of FMCG pack on a QoQ basis from Q2FY24 to Q3FY24!
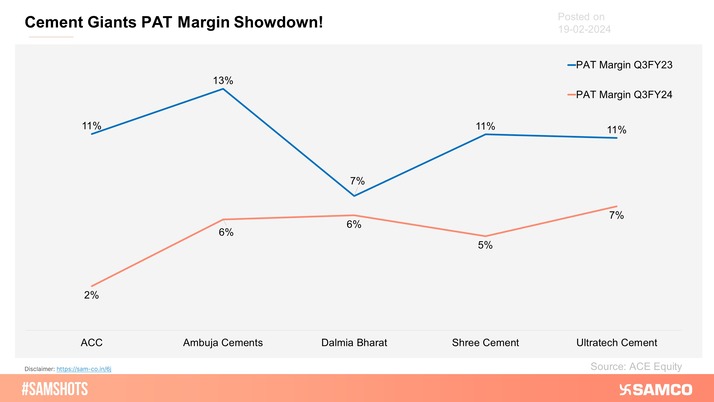
Here’s the YoY PAT margin comparison of major companies engaged in the cement sector!
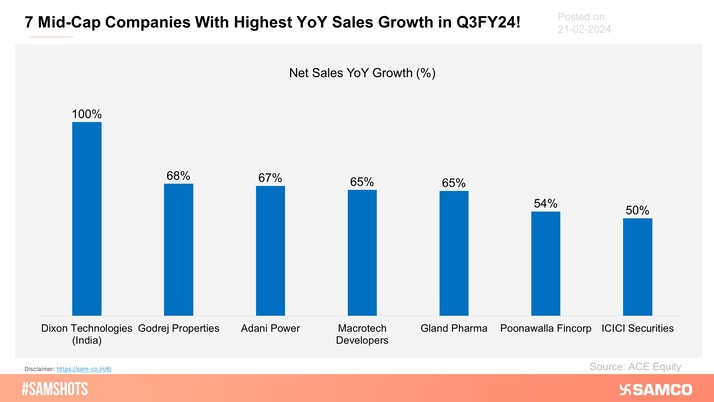
The below chart shows the 7 mid-cap companies with the highest YoY Sales Growth in Q3FY24.
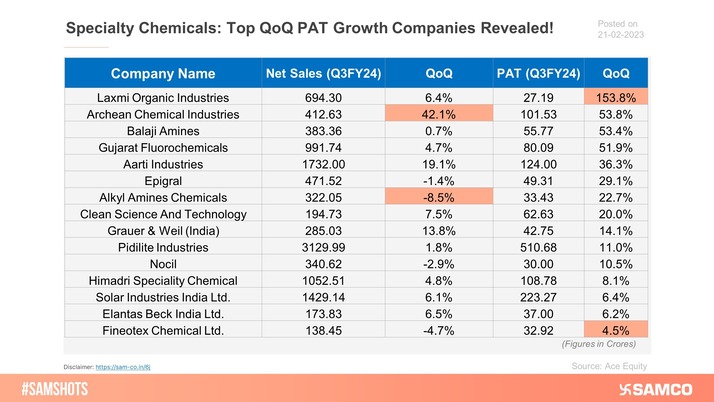
The accompanying chart showcases the Specialty companies’ performance in Q3FY24.
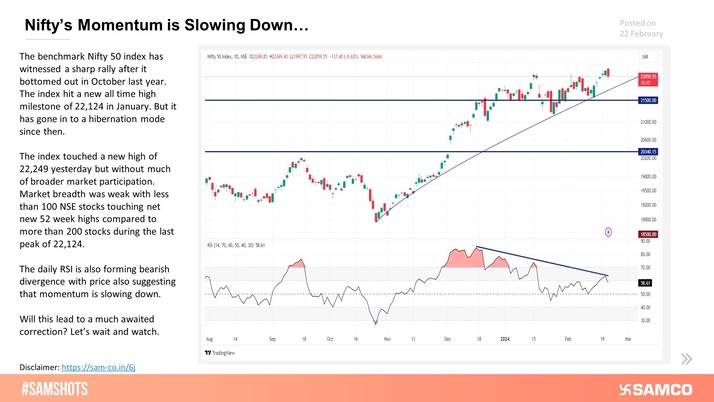
Here’s why Nifty’s Momentum is Slowing Down!
FPI Sector-wise Investment Inflow/Outflow In Previous 3 Fortnight!
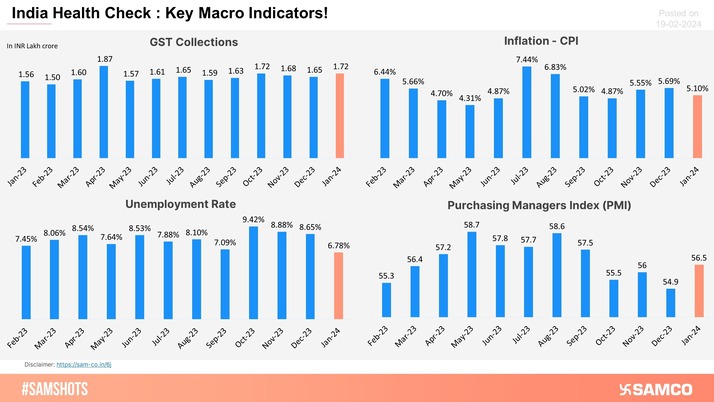
India Health Check: Trend of Key Macro Indicators!
Two Billion Dollar Monthly SIP Inflows is Driving Our Markets!
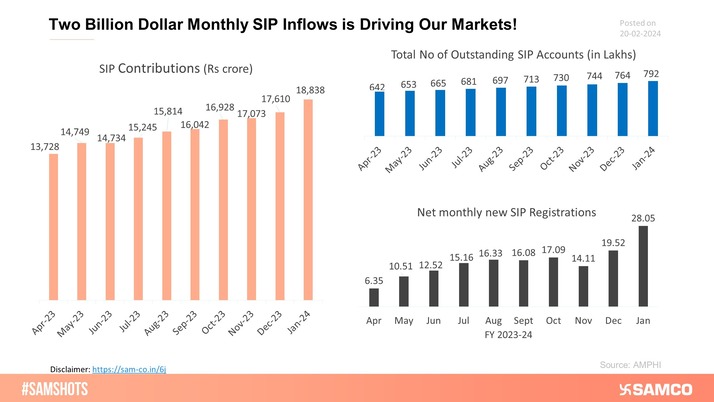
ABB zoomed past its daily resistance range of 4,900-4,950 on 21st February. The stock rose along with huge spike in volumes.
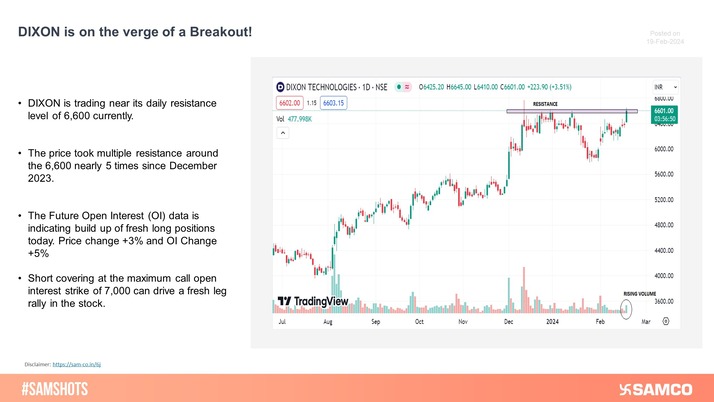
DIXON is trading above its daily resistance level of 6,600 on the daily chart. The price took multiple resistance around these levels nearly 5 times since December 2023
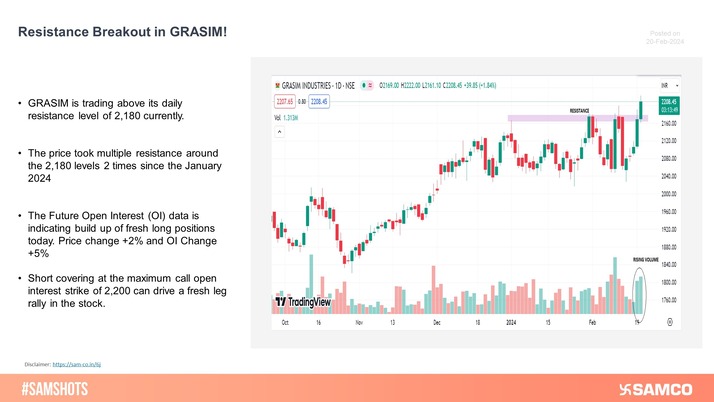
GRASIM is currently trading above its daily resistance level of 2,180. The breakout is supported by rise in volumes in the last two trading sessions
Prestige Estate sustained above 50 SMA with high volumes
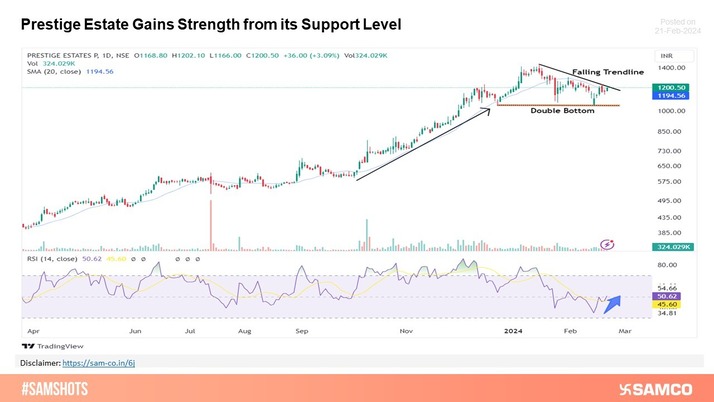
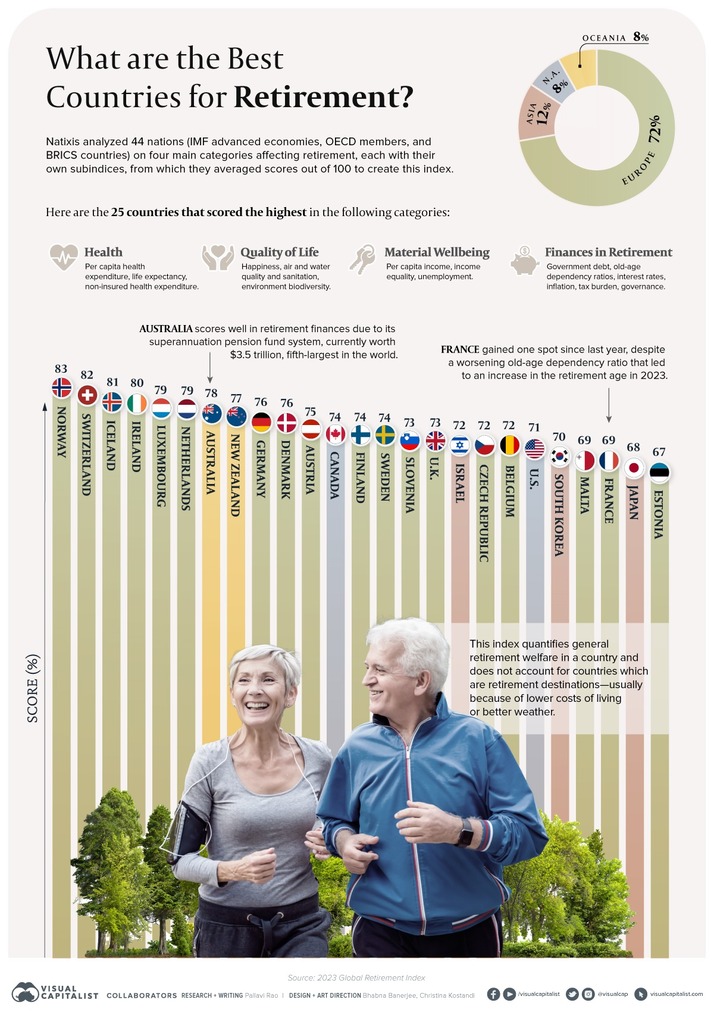
Image Source: @VisualCap (Twitter)


 Easy & quick
1. Register on SCORES portal
2. Mandatory details for filling complaints on SCORES
Name | PAN | Address | Mobile | Number | E-mail ID
3. Benefits
Effective Communication
Speedy redressal of the grievances
