The Nifty 50 ended the week on a subdued note, declining approximately 1.5% from its previous close of 25,571 to settle around 25,510, weighed down by a confluence of global headwinds and geopolitical uncertainties. Sentiment turned sharply negative mid-week after U.S. President Trump threatened retaliatory tariffs on nations aligning with a U.S. Supreme Court ruling, triggering broad-based selling. Adding to the unease, escalating tensions between Pakistan and Afghanistan, coupled with PM Narendra Modi's visit to Israel amid a volatile Middle East, kept investor risk appetite firmly in check.
On the sectoral front, Nifty Pharma (+2.23%) emerged as the top performer, followed by Nifty Metal (+1.85%). On the other side, Nifty IT bore the brunt of AI disruption fears and global tech weakness, while Nifty Realty remained under pressure amid tight liquidity and risk-off sentiment.
Looking ahead, markets will closely watch developments on the India-U.S. trade deal, further U.S. tariff announcements, the Pakistan-Afghanistan border situation, and India's Q4 GDP data all of which are likely to set the directional tone for the weeks ahead.
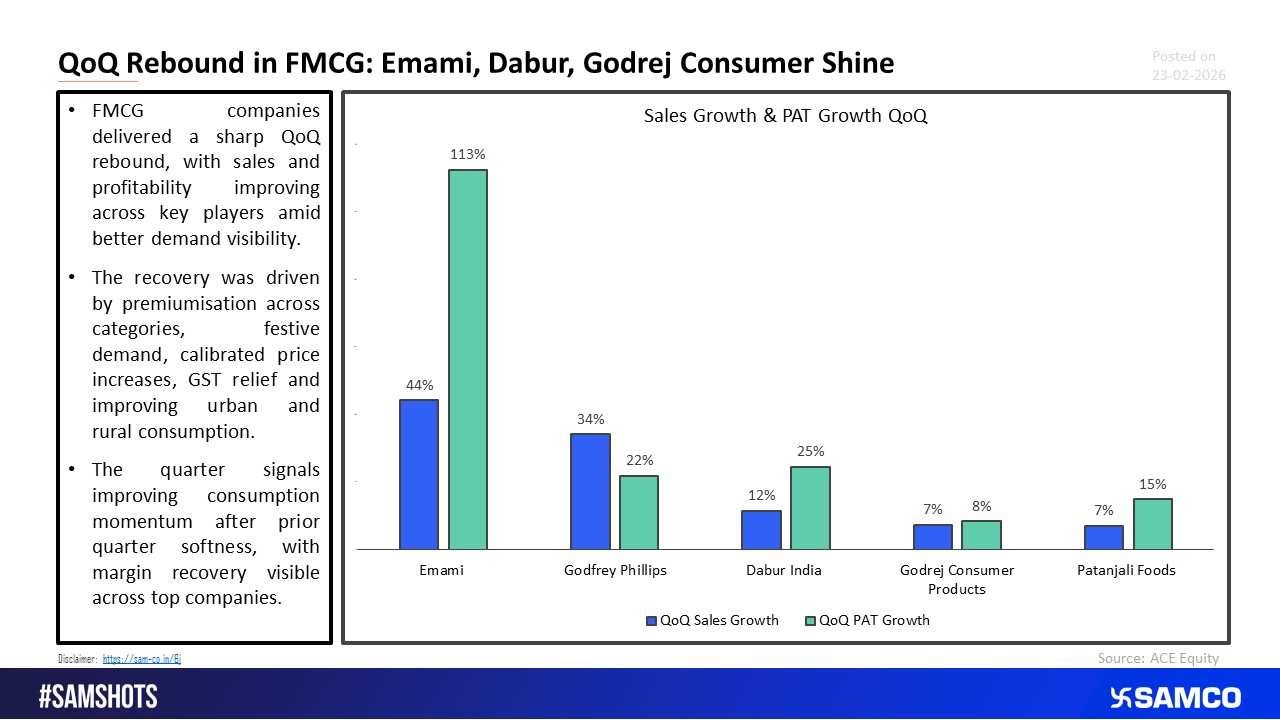
FMCG Companies Shine QoQ on Demand and Volume Expansion


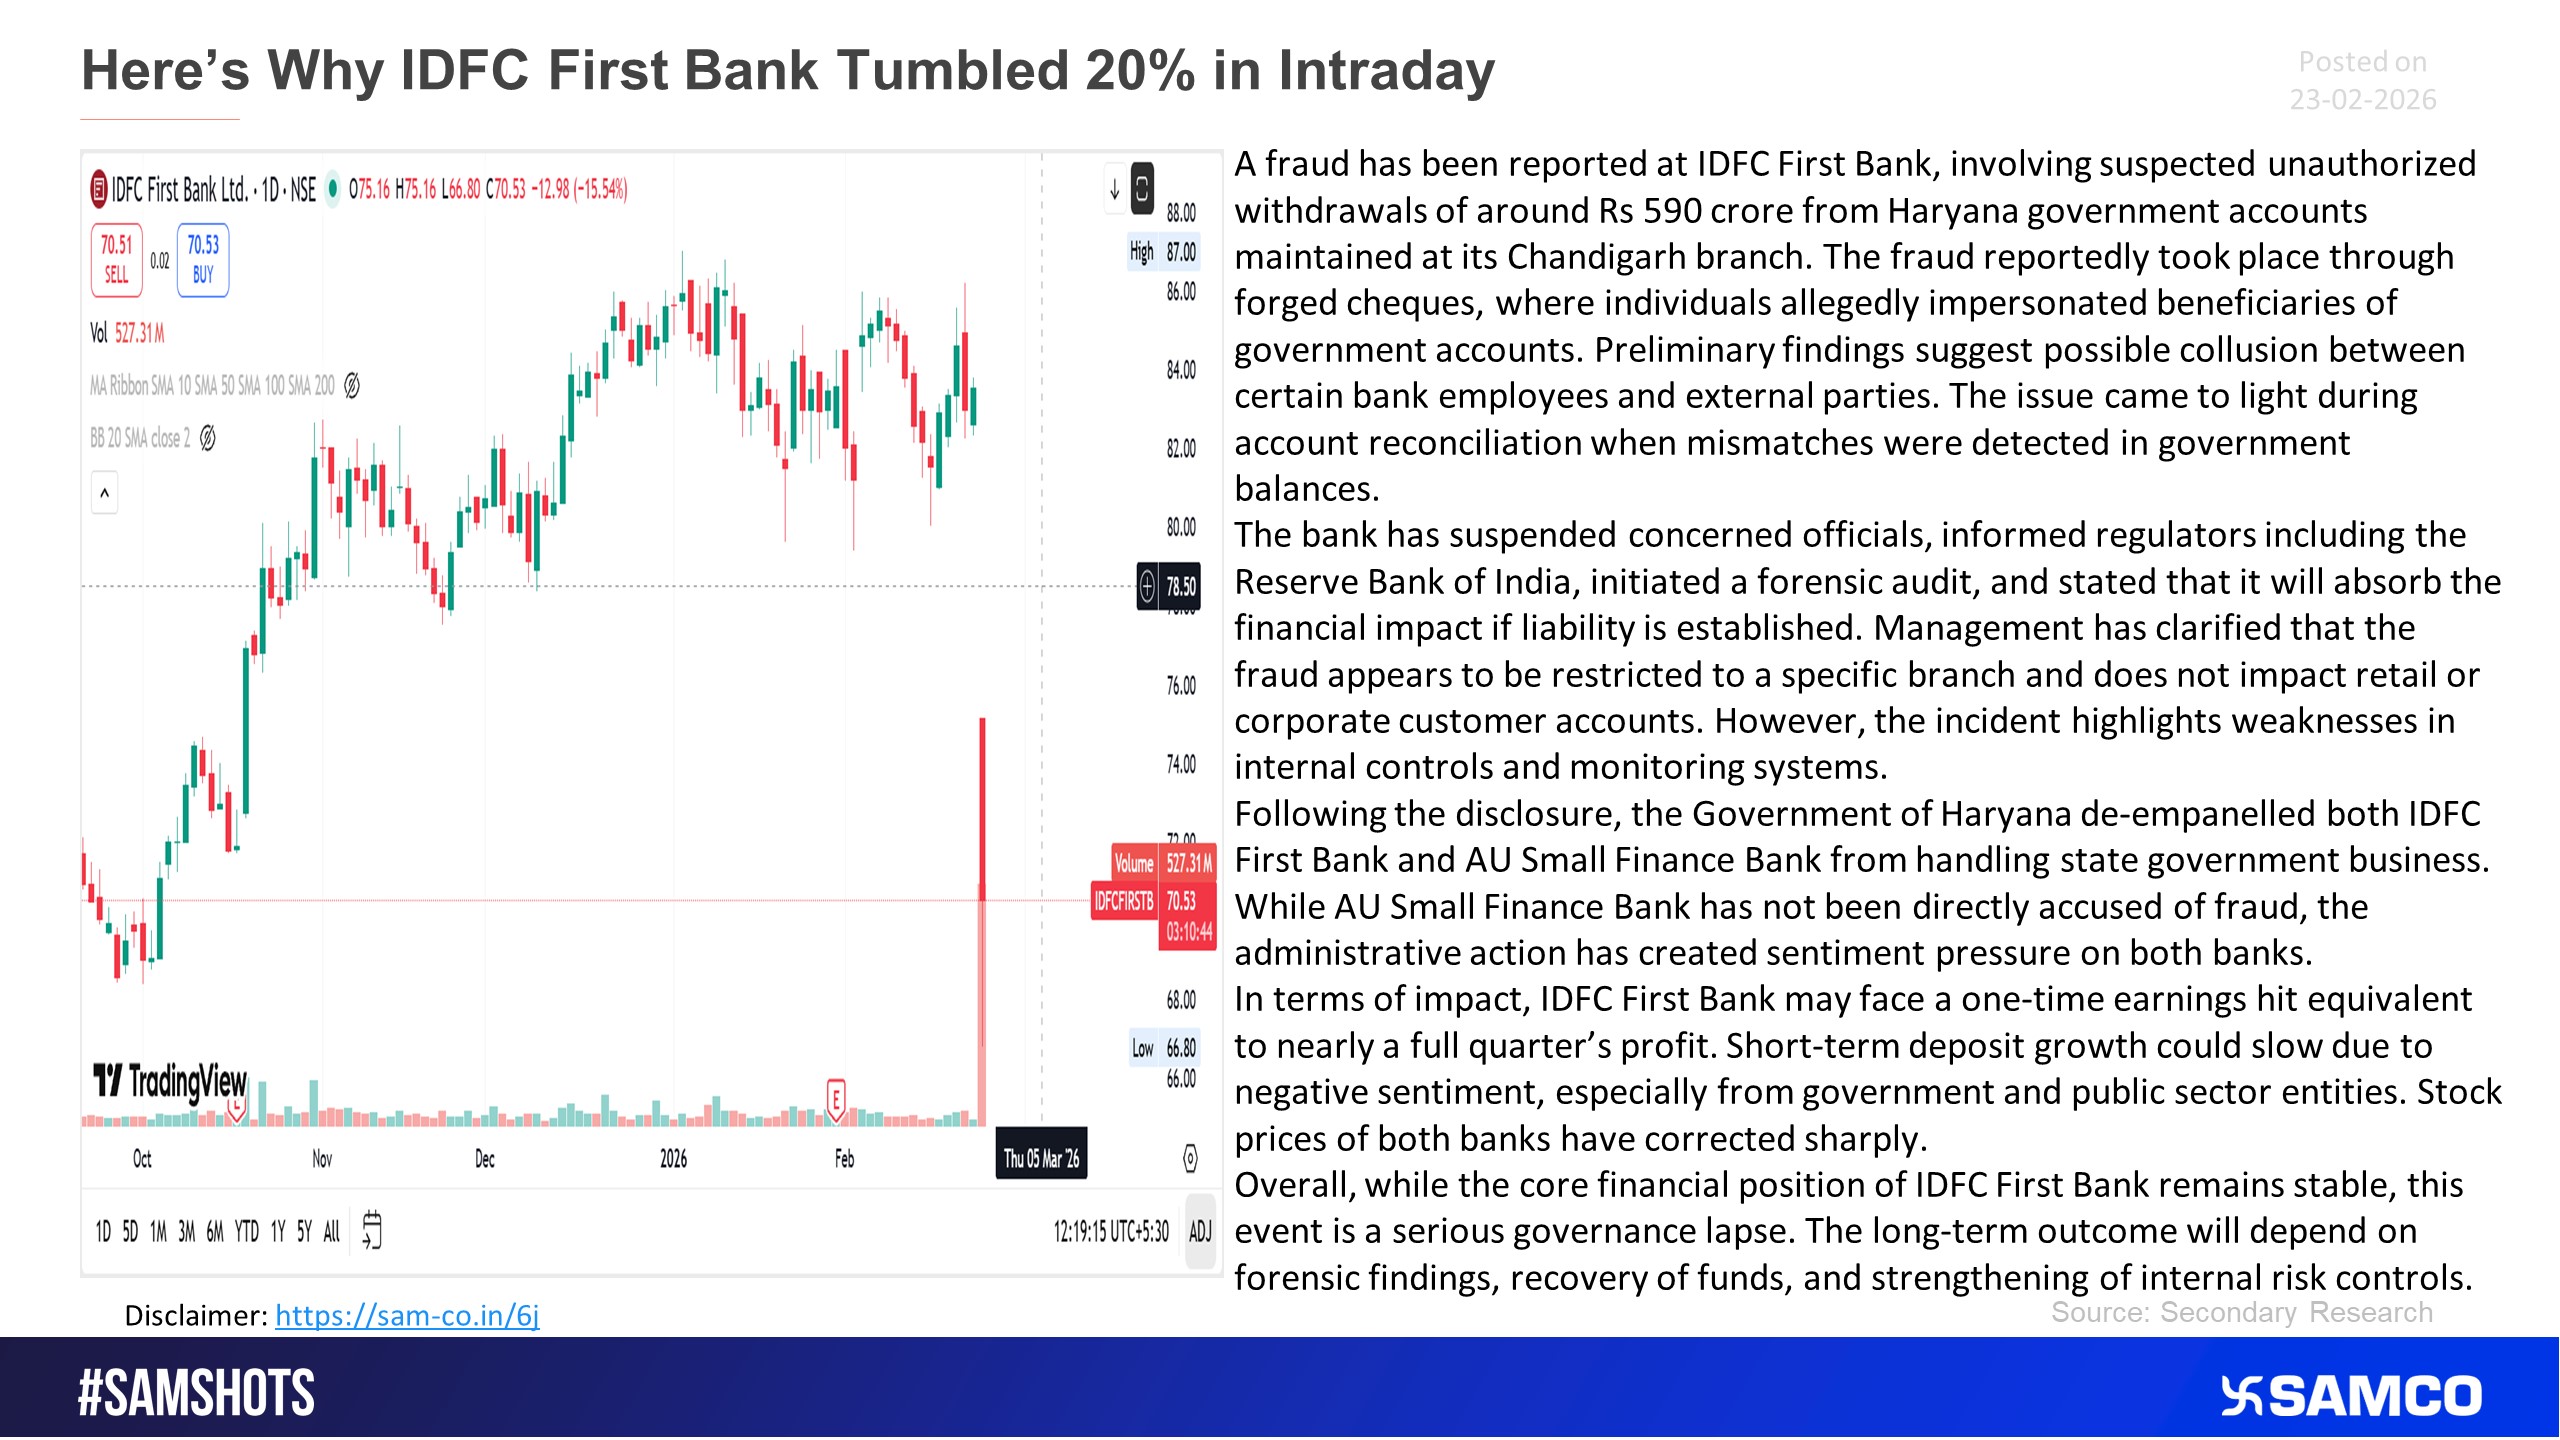
Here’s why IDFC first bank fell on 23rd Feb 2026.
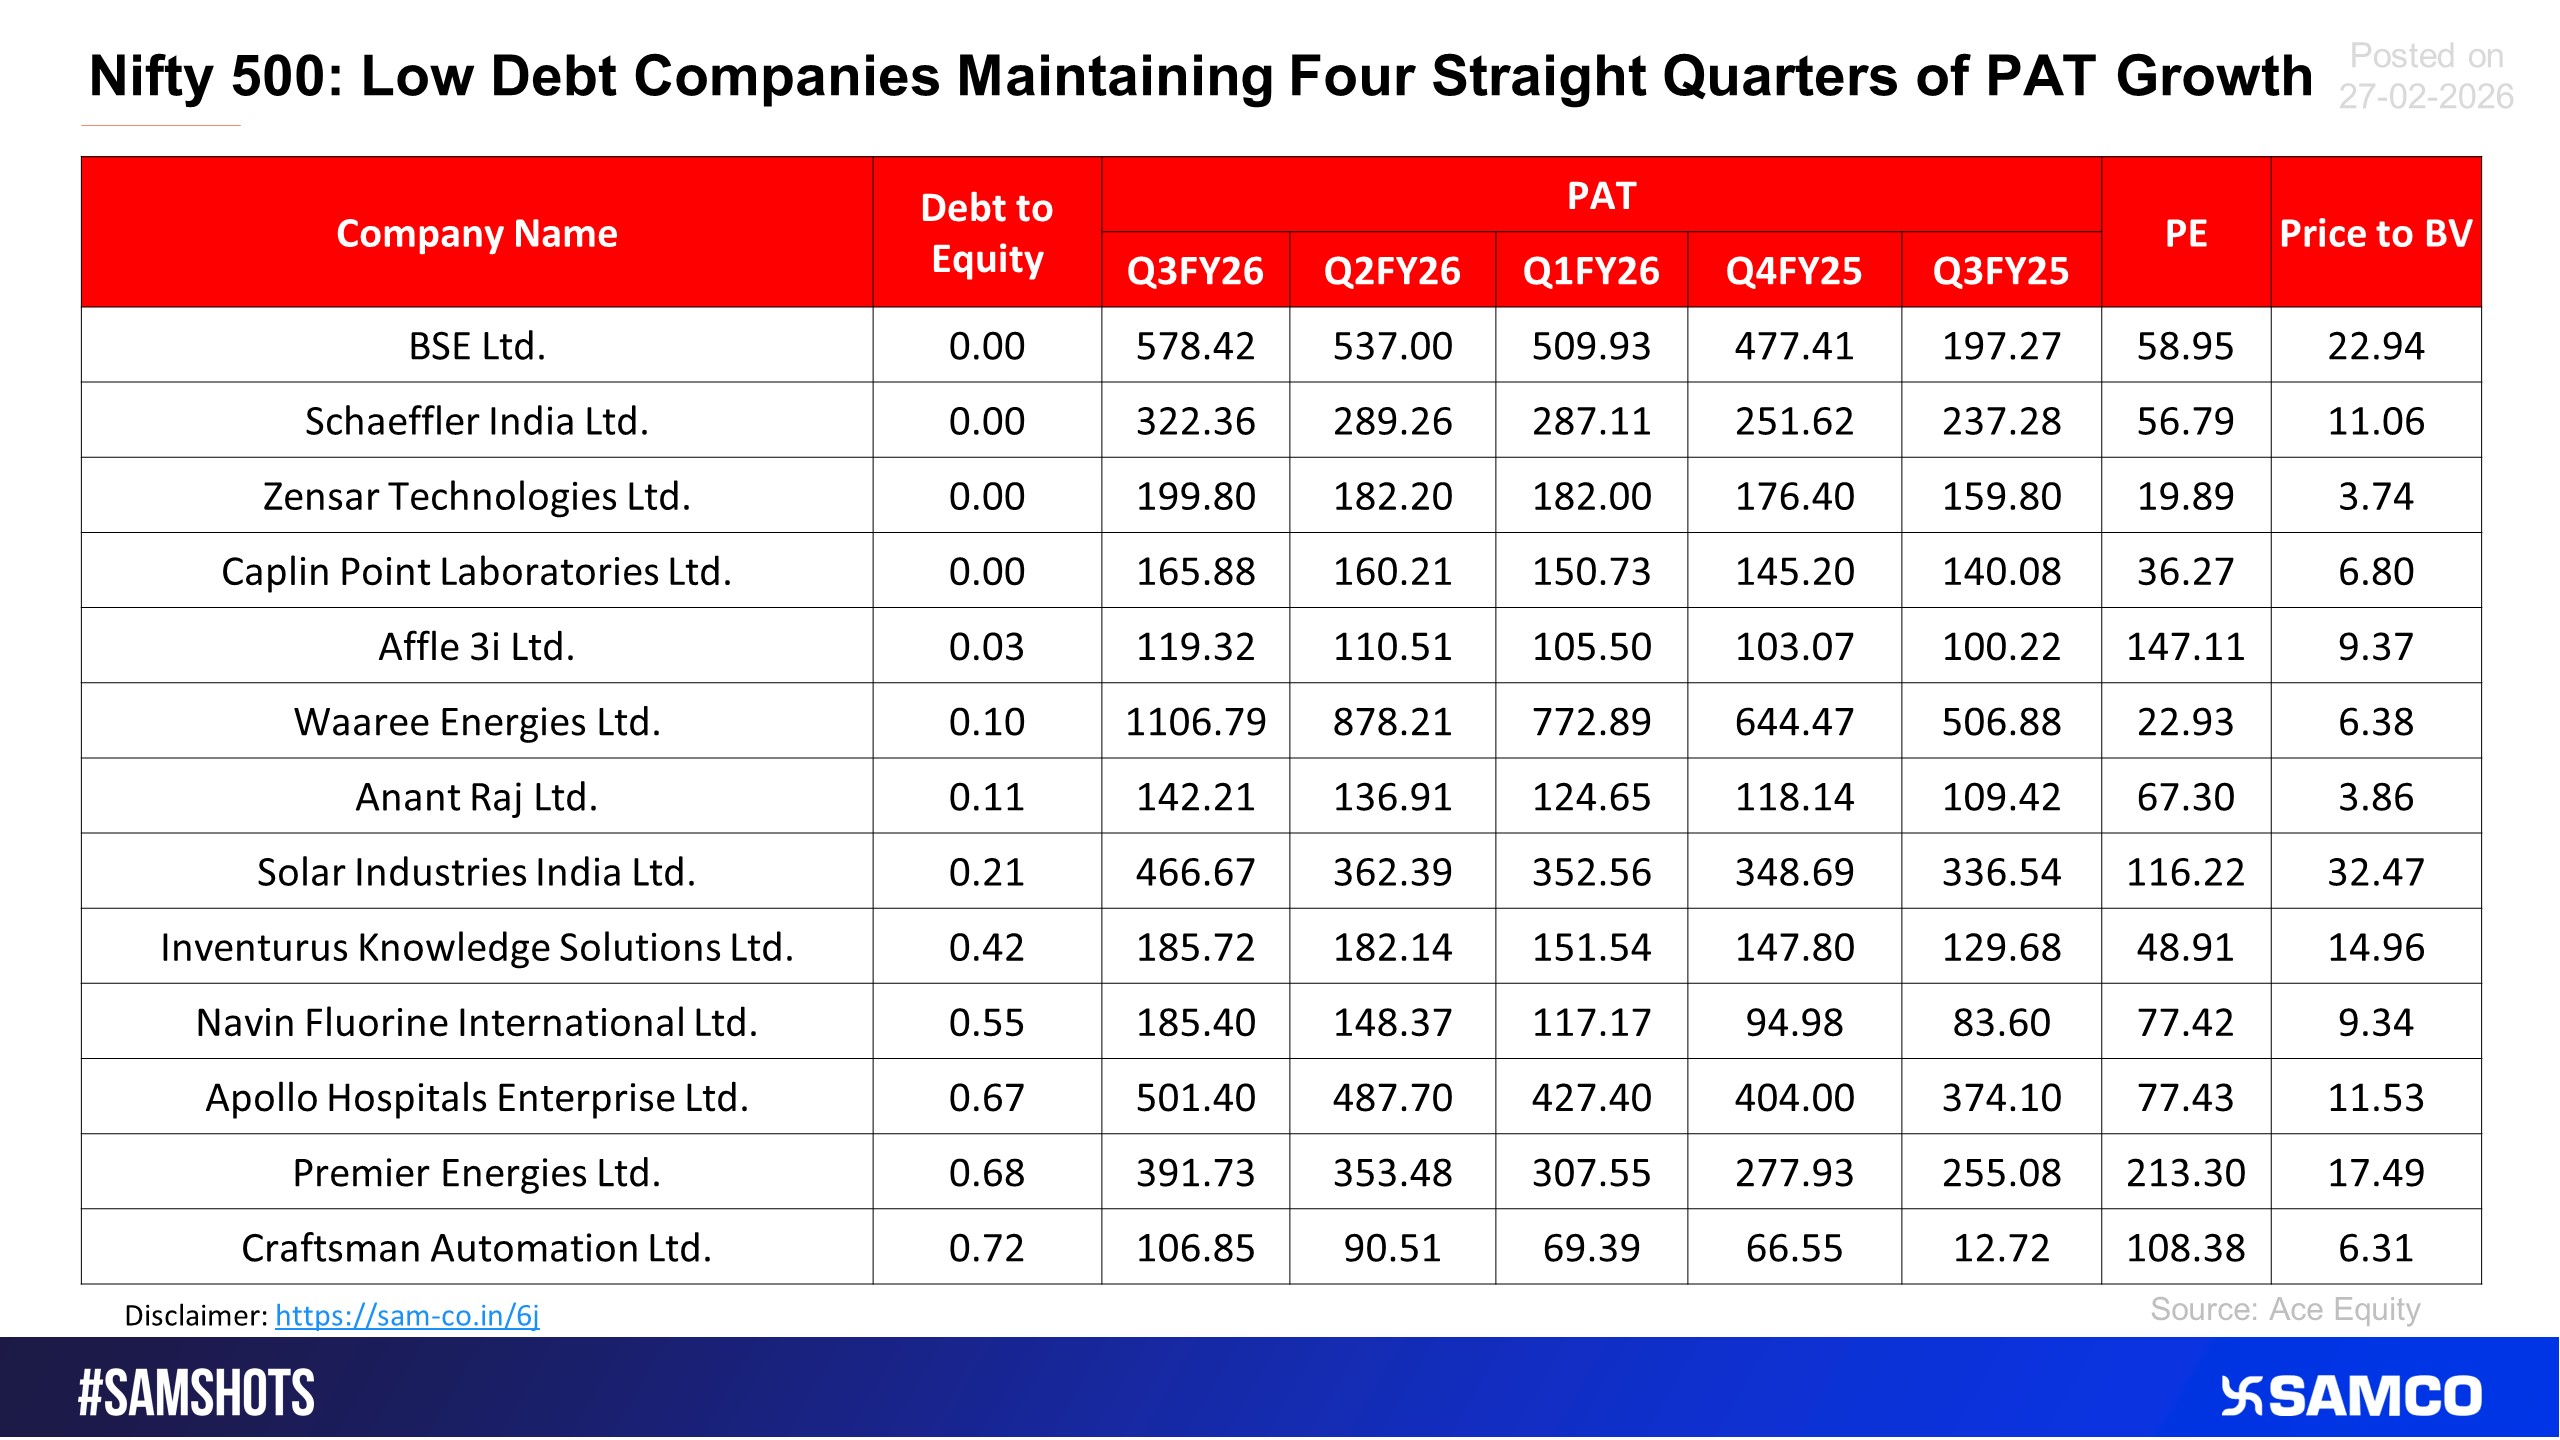
The below list shows companies which showed consistent improvement in PAT over the past 4 quarters.
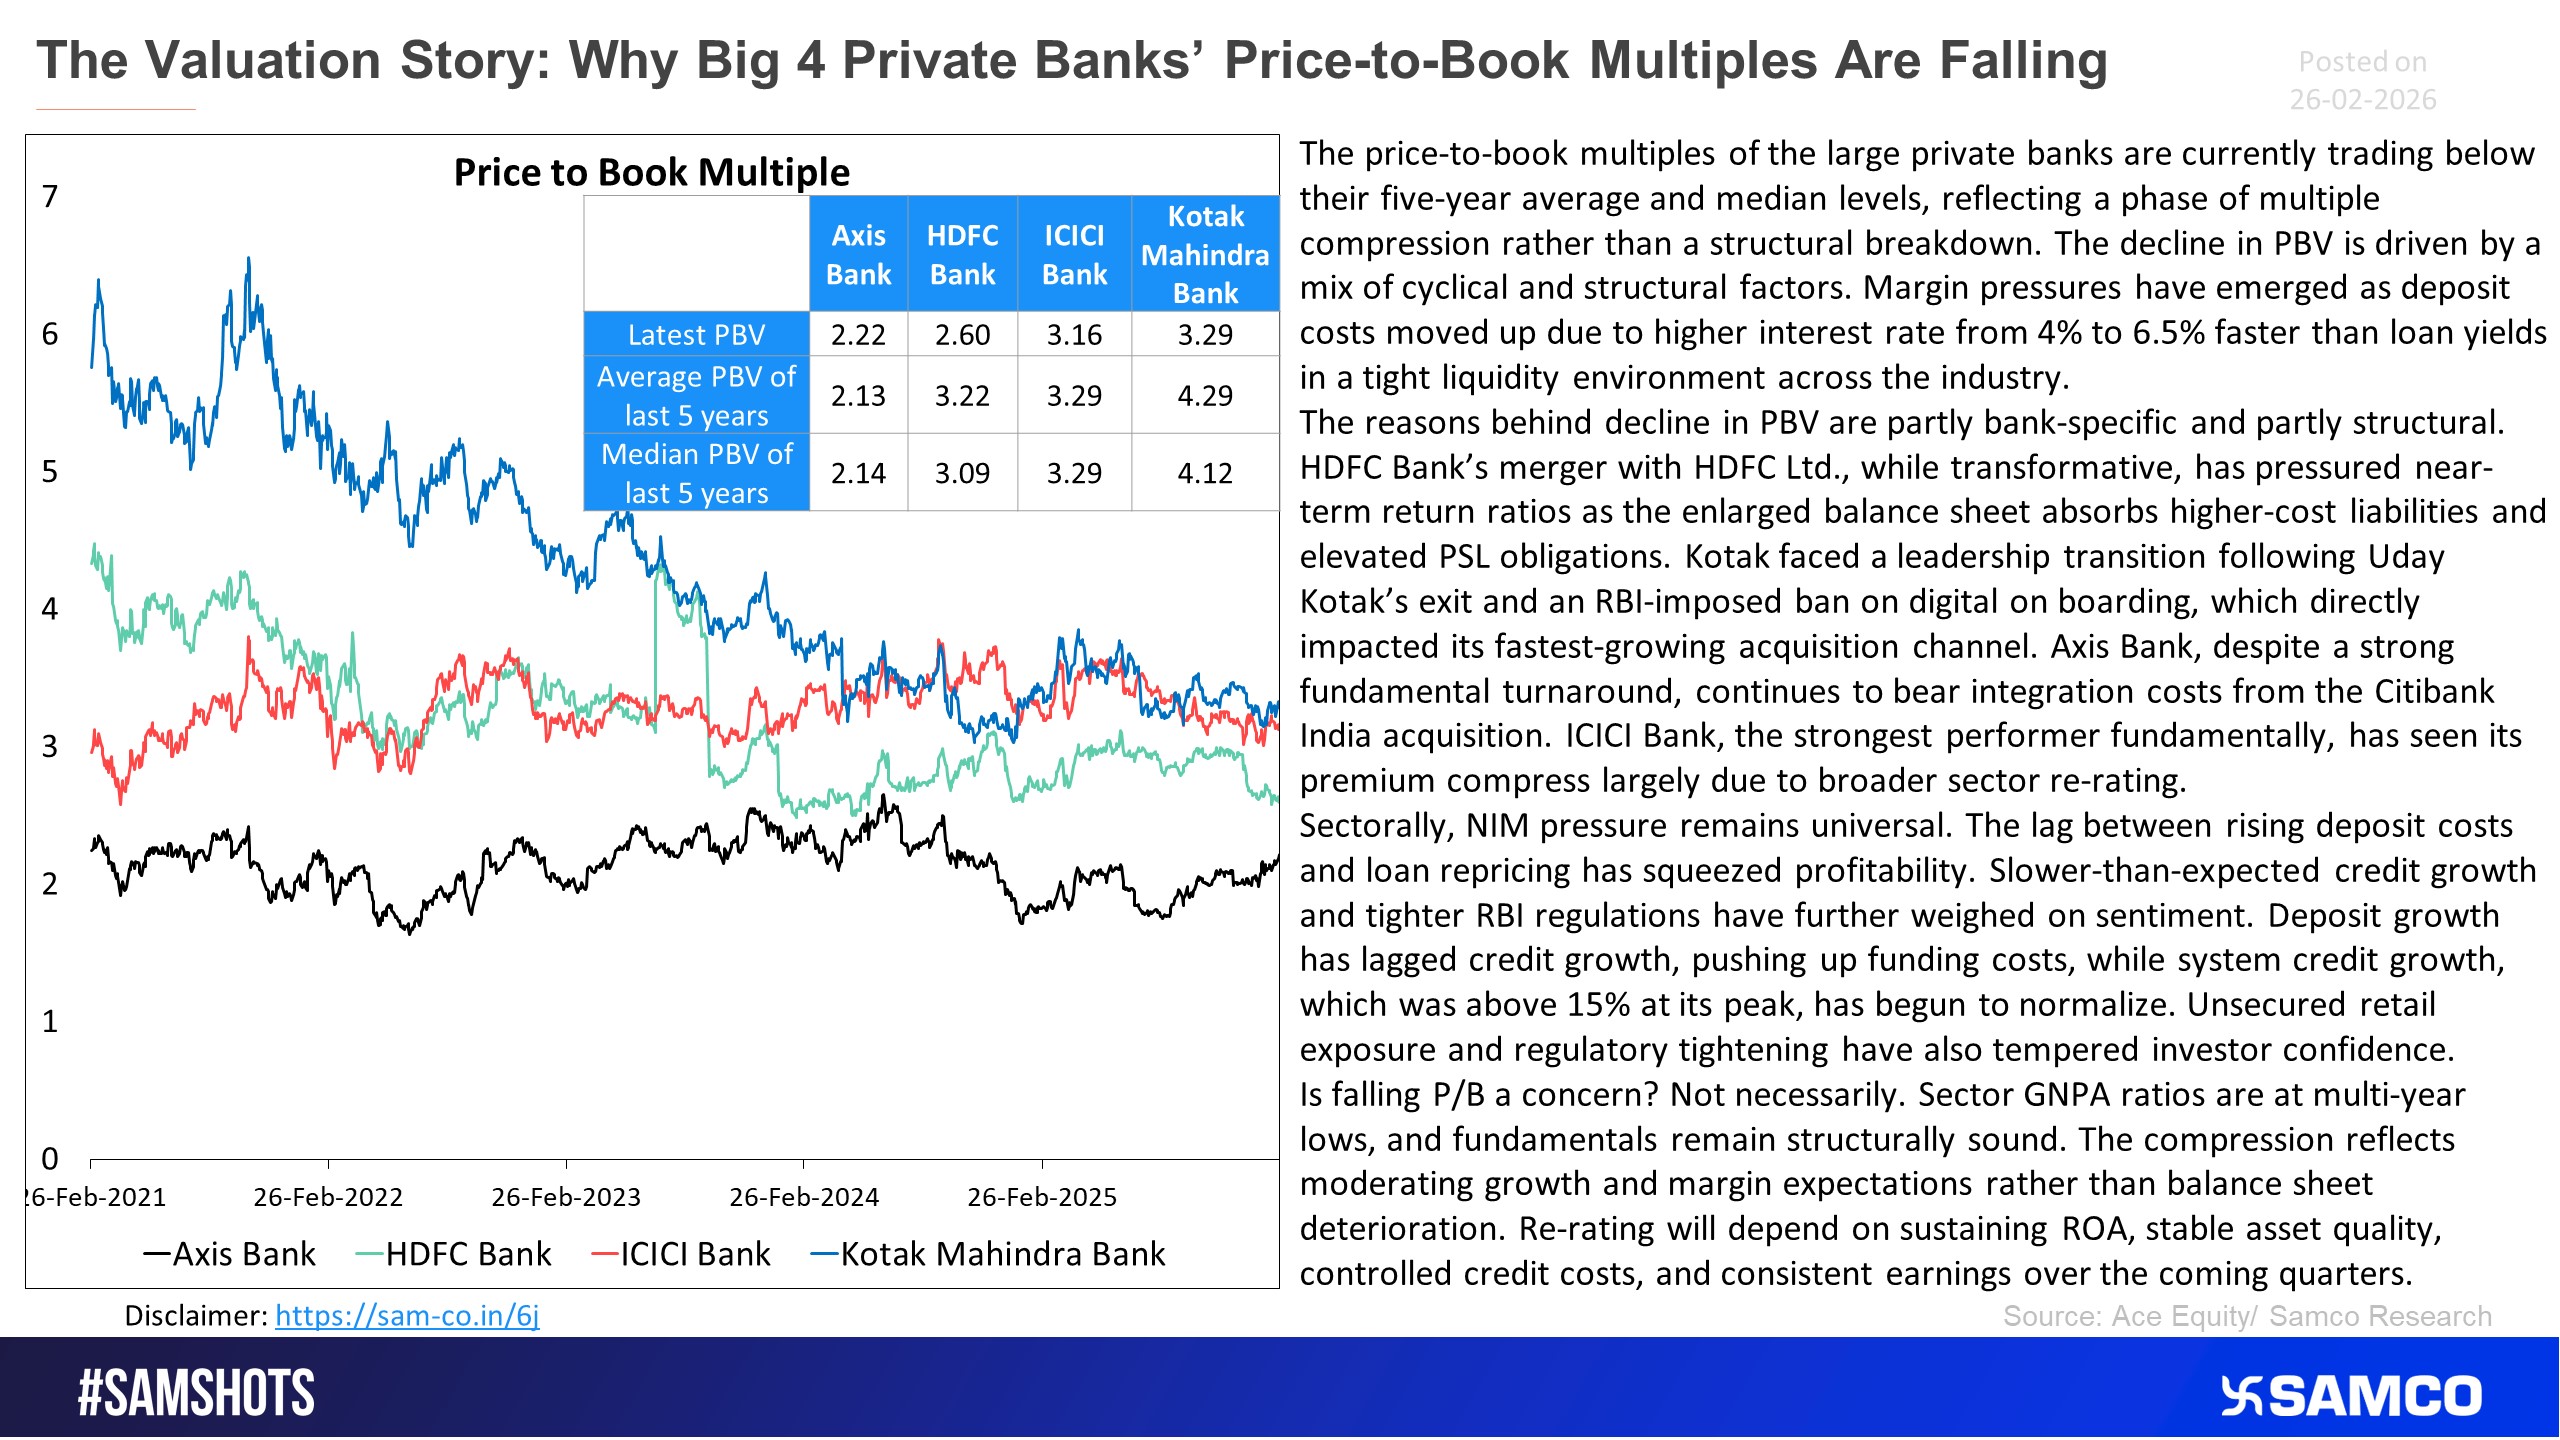
The big 4 private banks PBV is falling, and this gives insight about what\'s exactly happening in it.
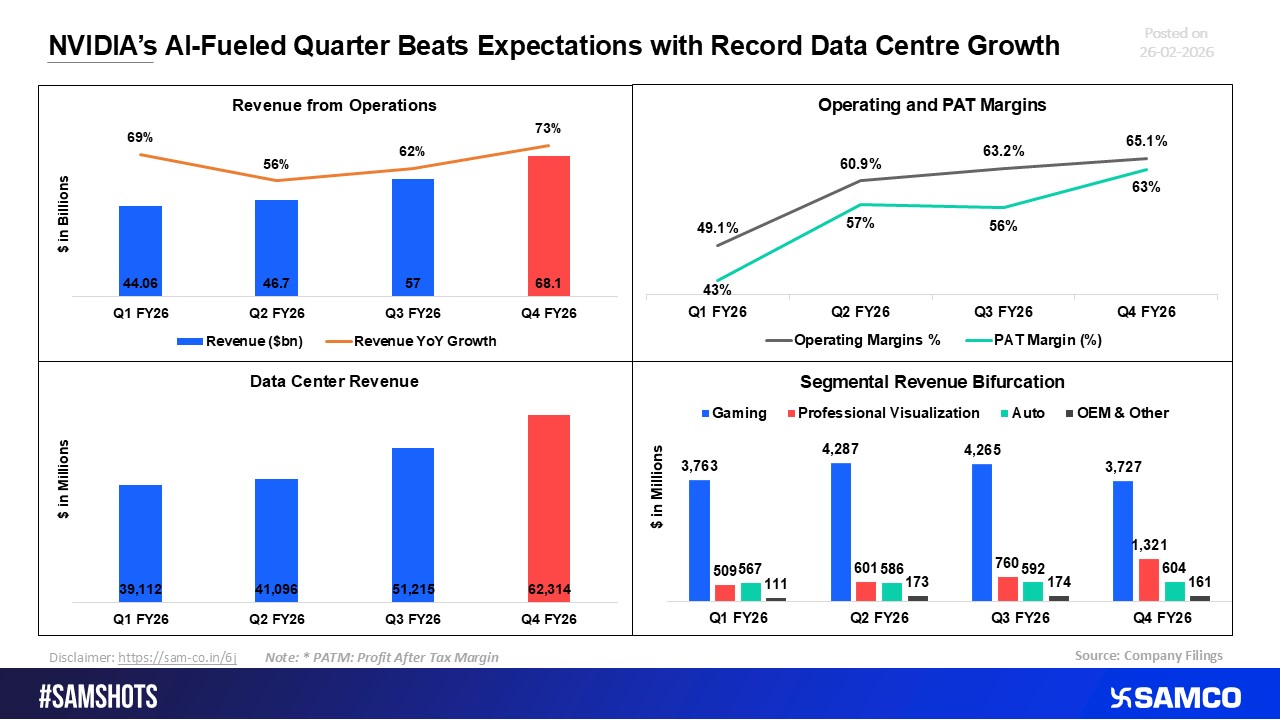
NVIDIA Beats Street Estimates on the Back of Explosive AI Data Center Sales
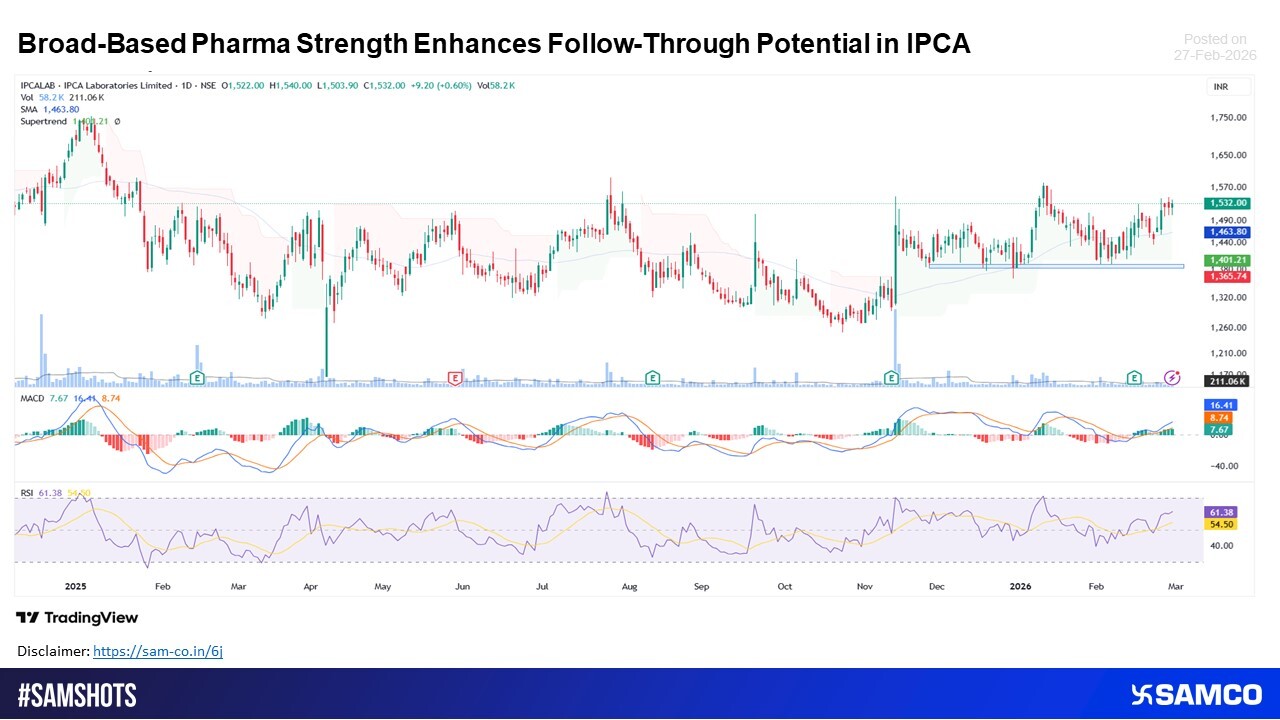
Sustained Recovery in IPCA Signals Gradual Upside Continuation
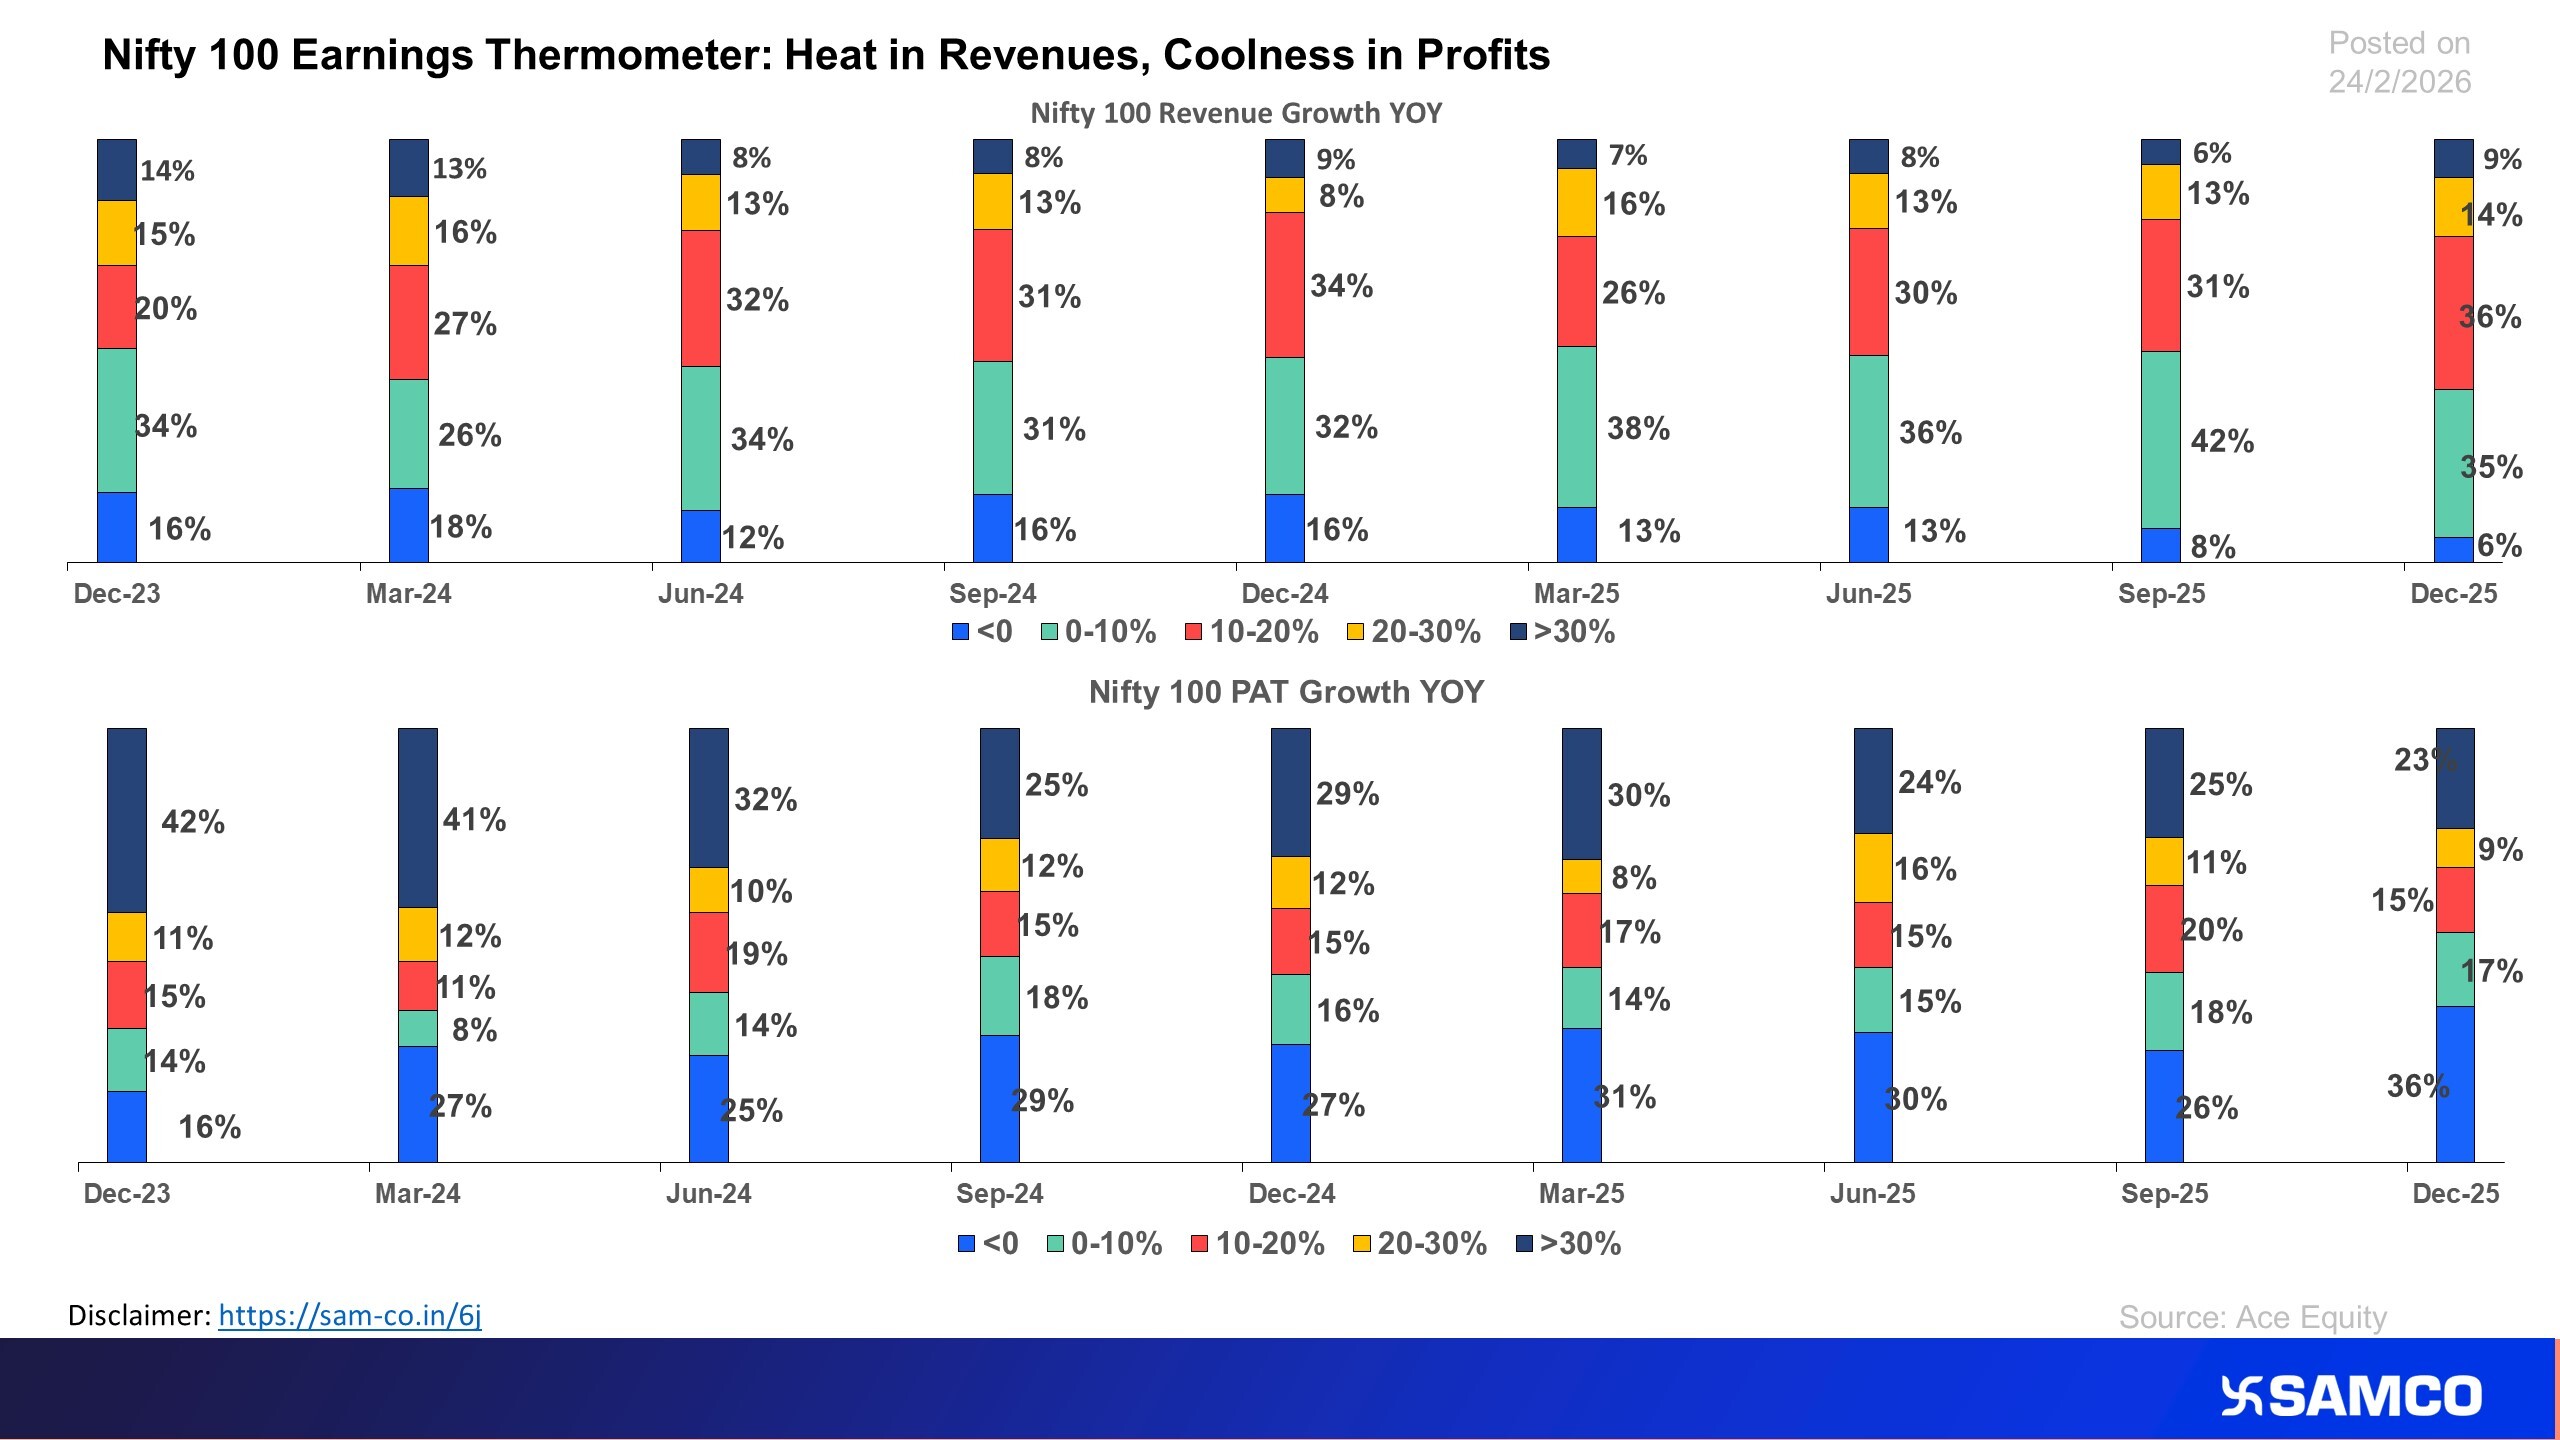
The chart analyses the revenue and PAT Growth for Nifty 100 companies in Q3FY26
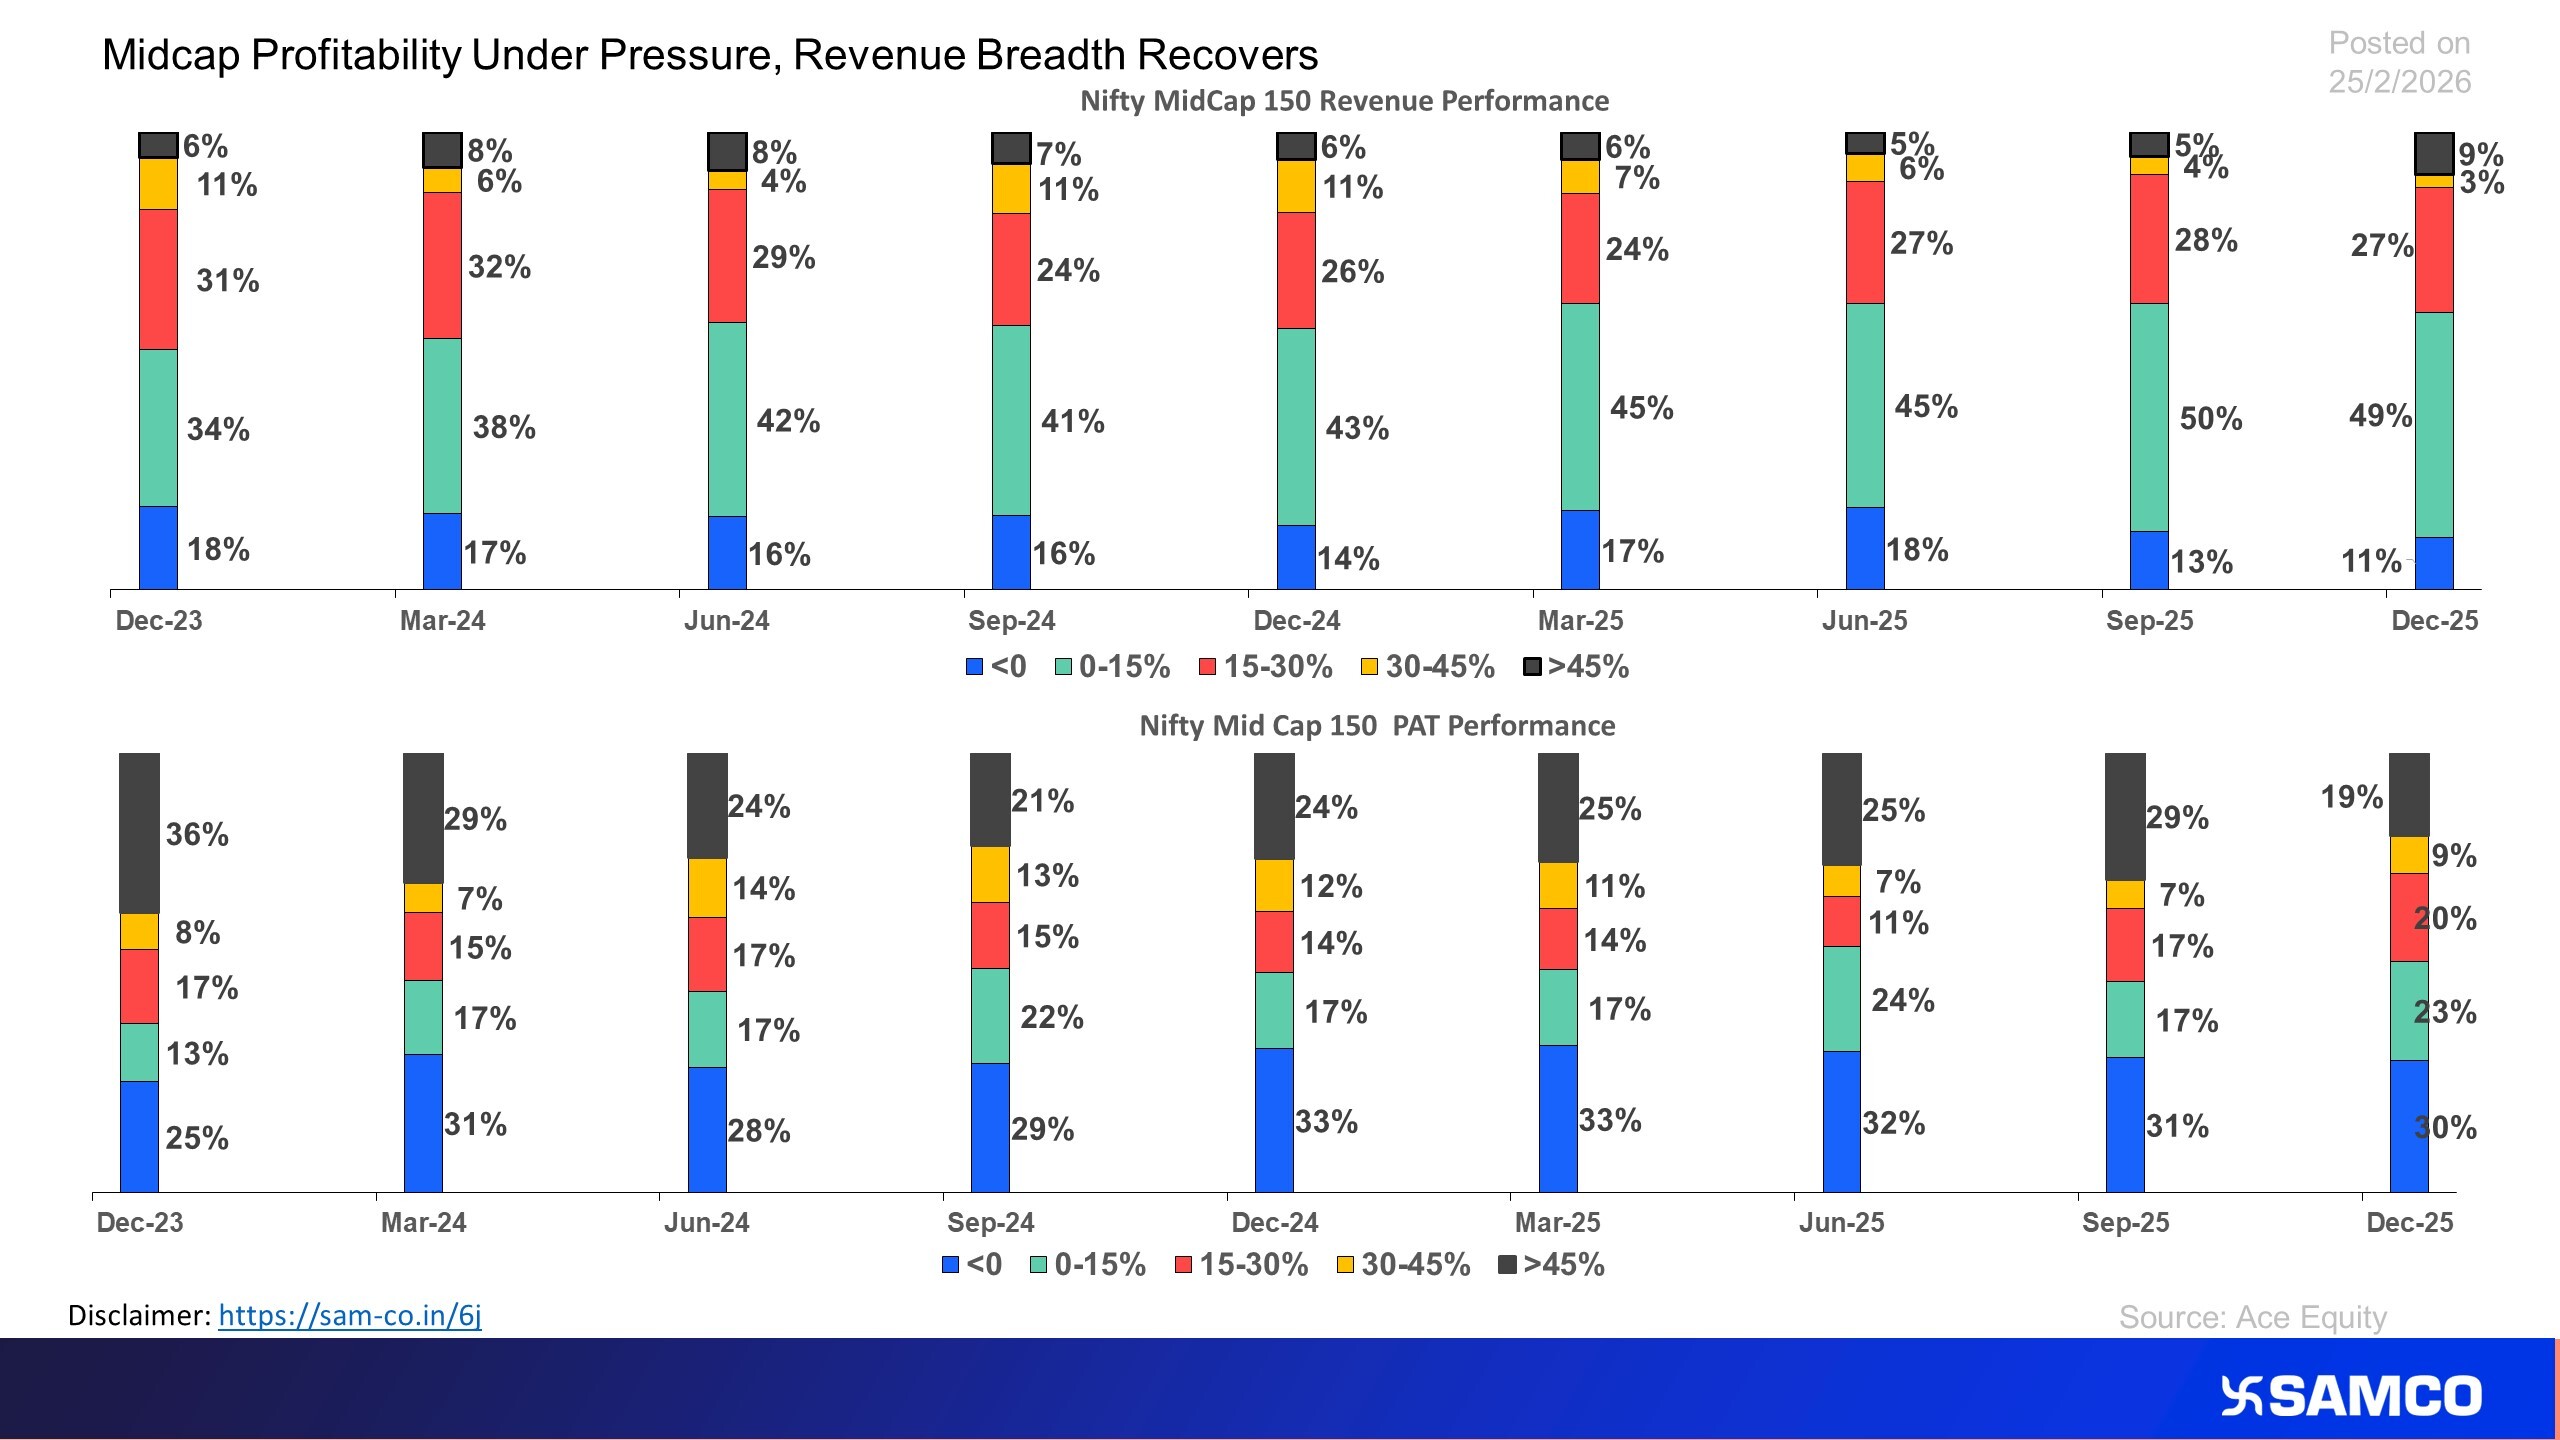
Midcap Sees Revenue Growth however subdued PAT growth in Q3FY26
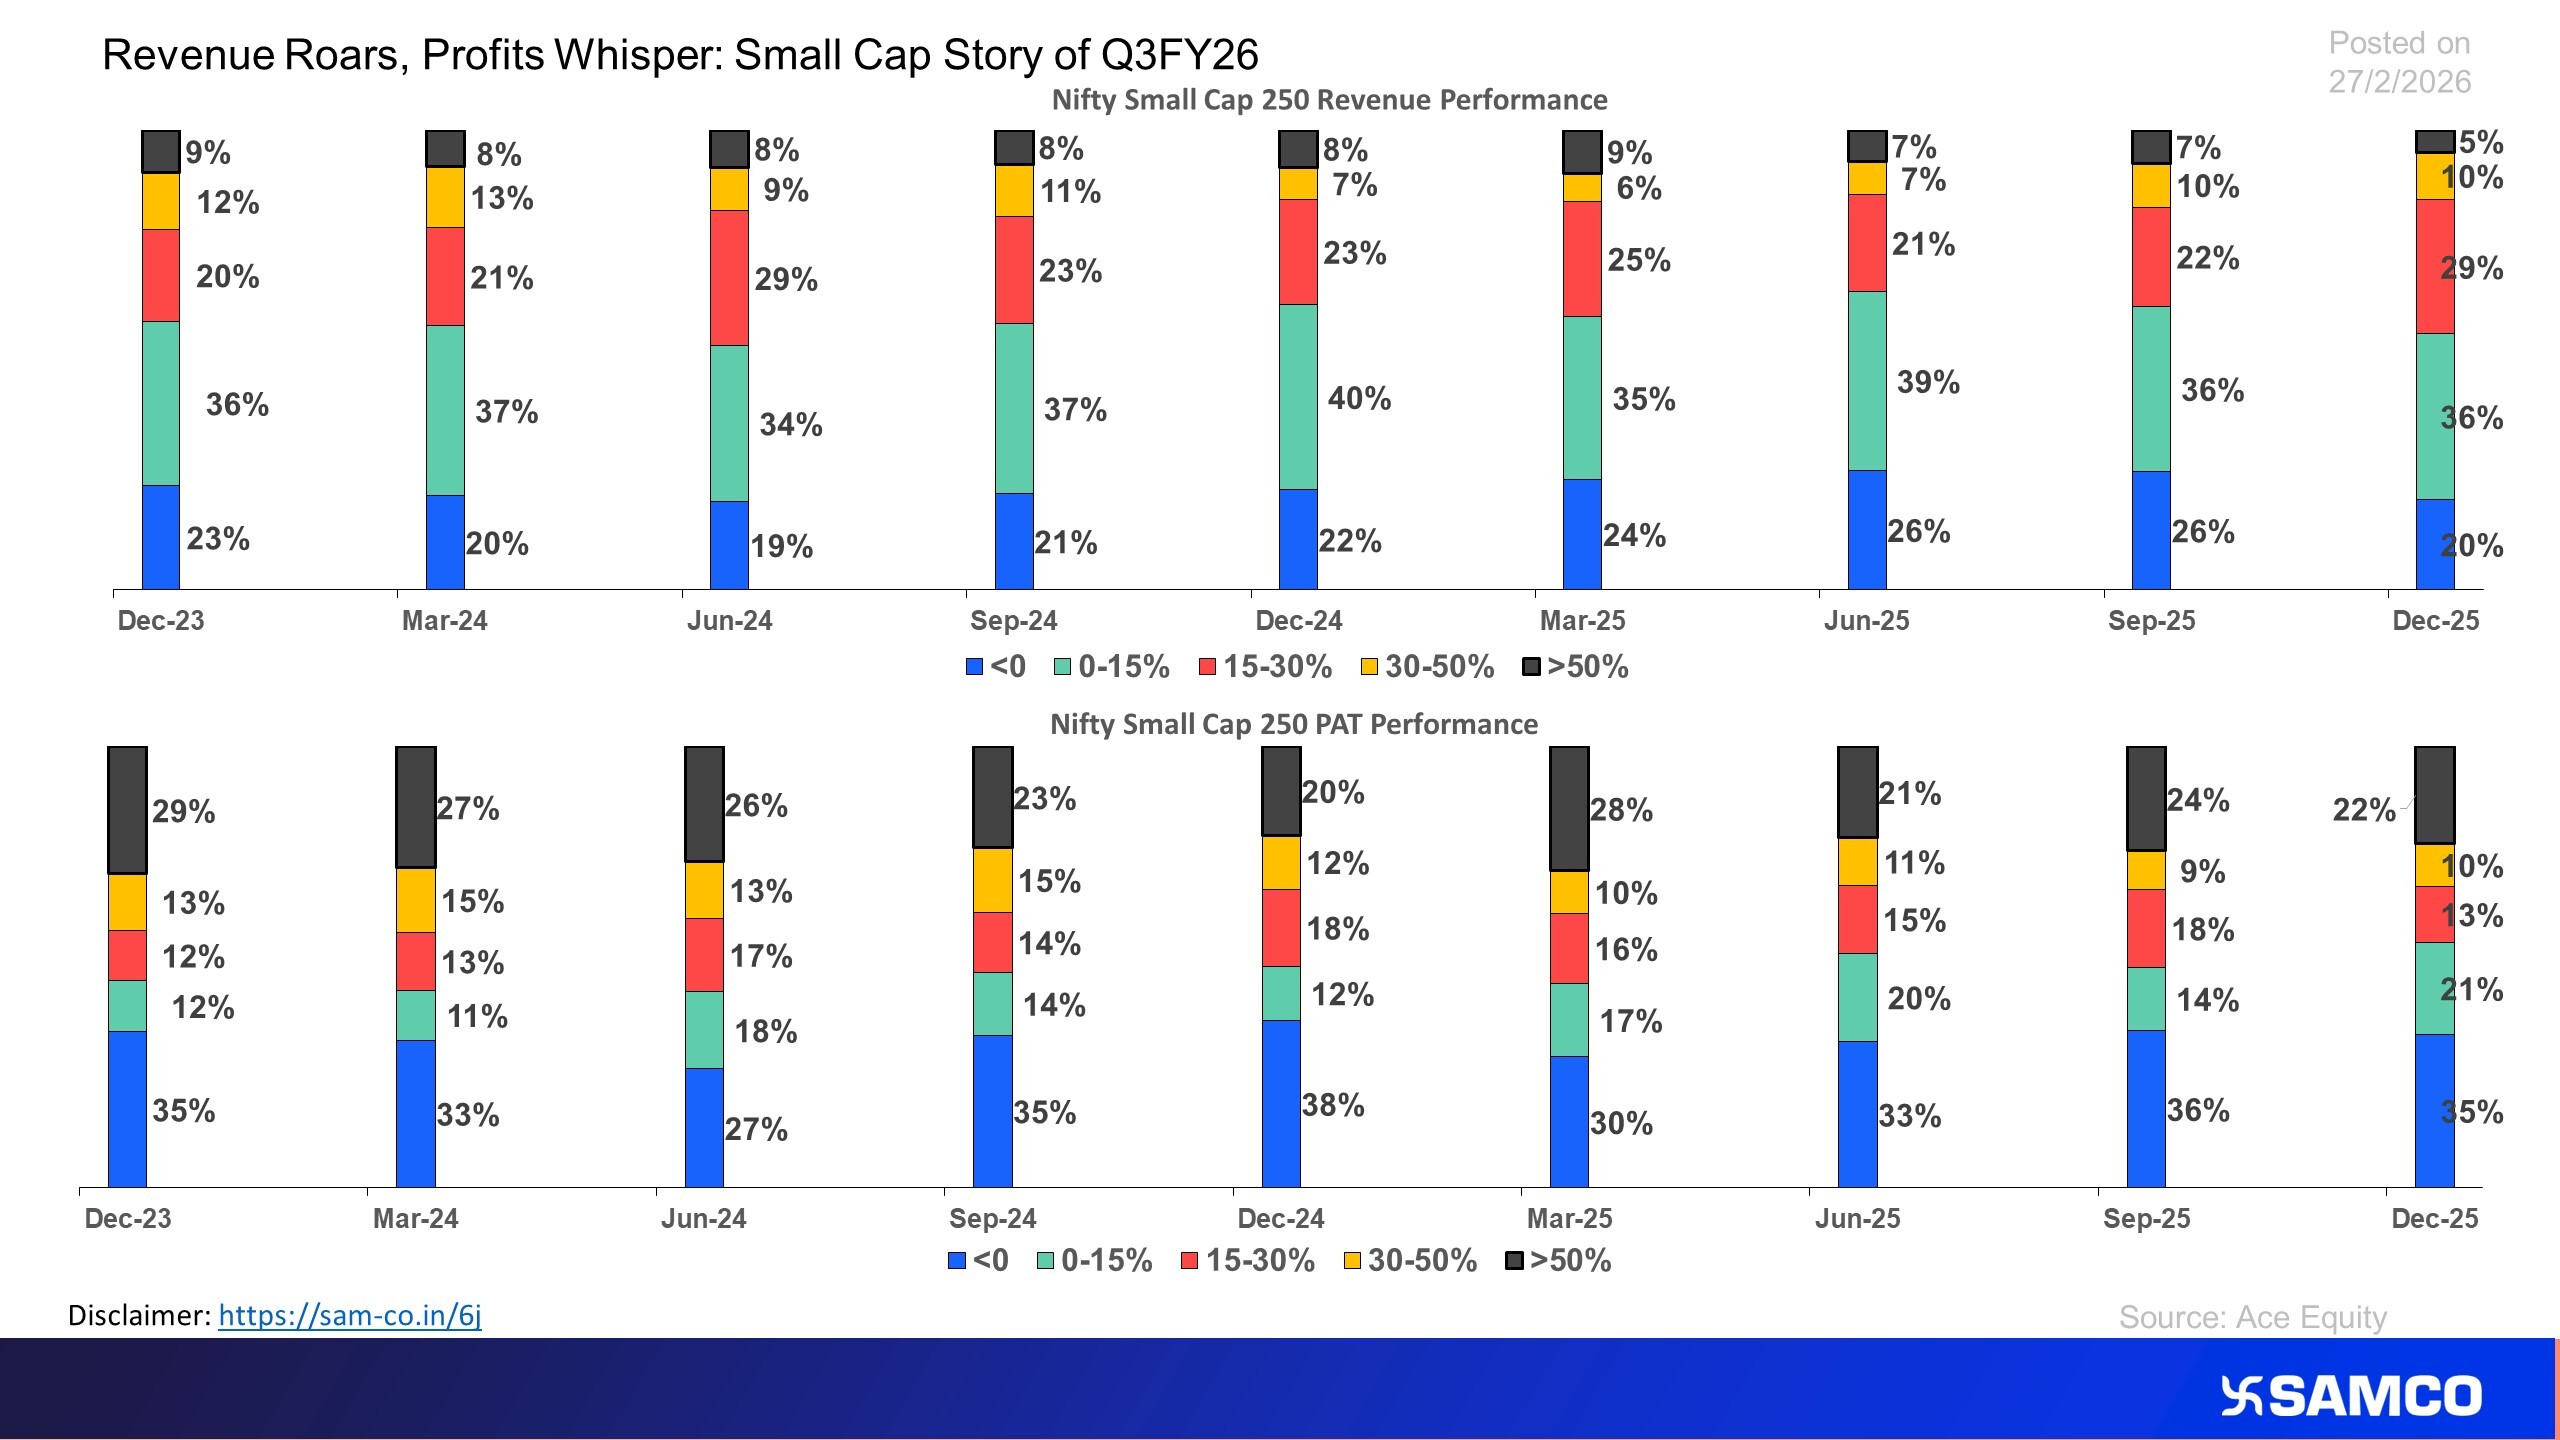
Small Cap 250 Shines on Both Parameters in Q3FY26
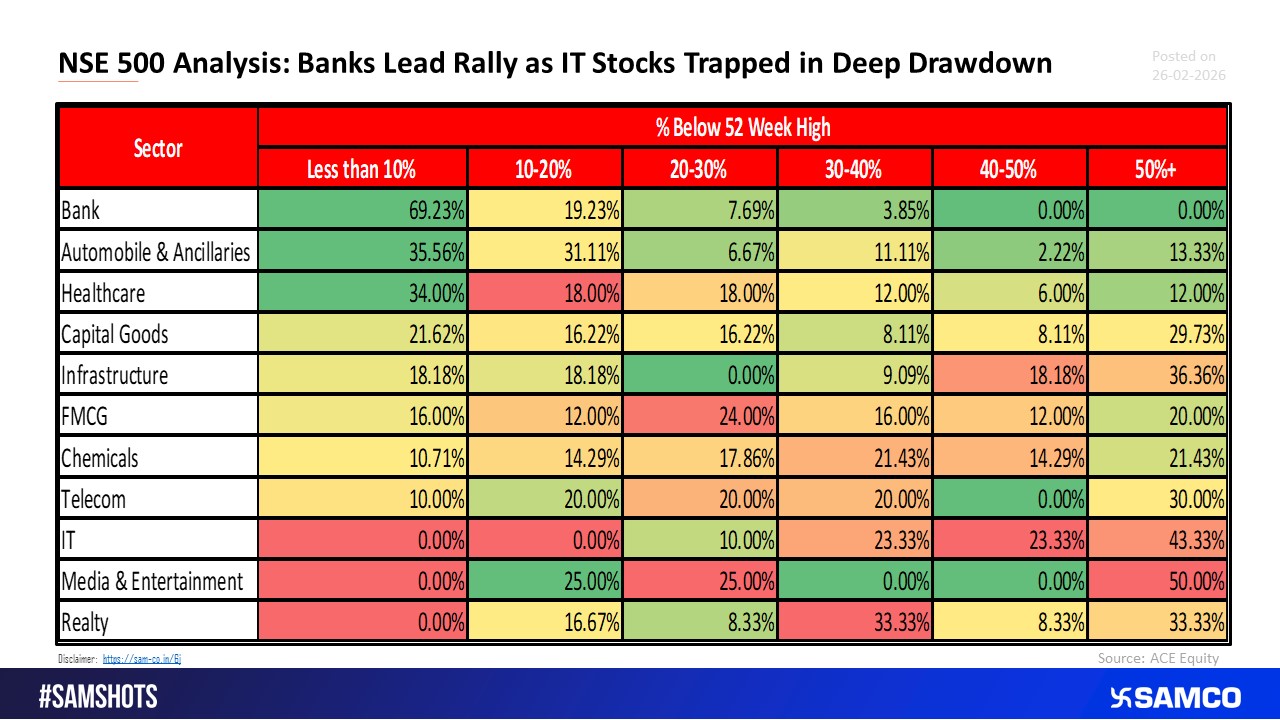
NSE 500 Market Breadth Analysis Across Sectors: Banking, Autos and Healthcare Lead
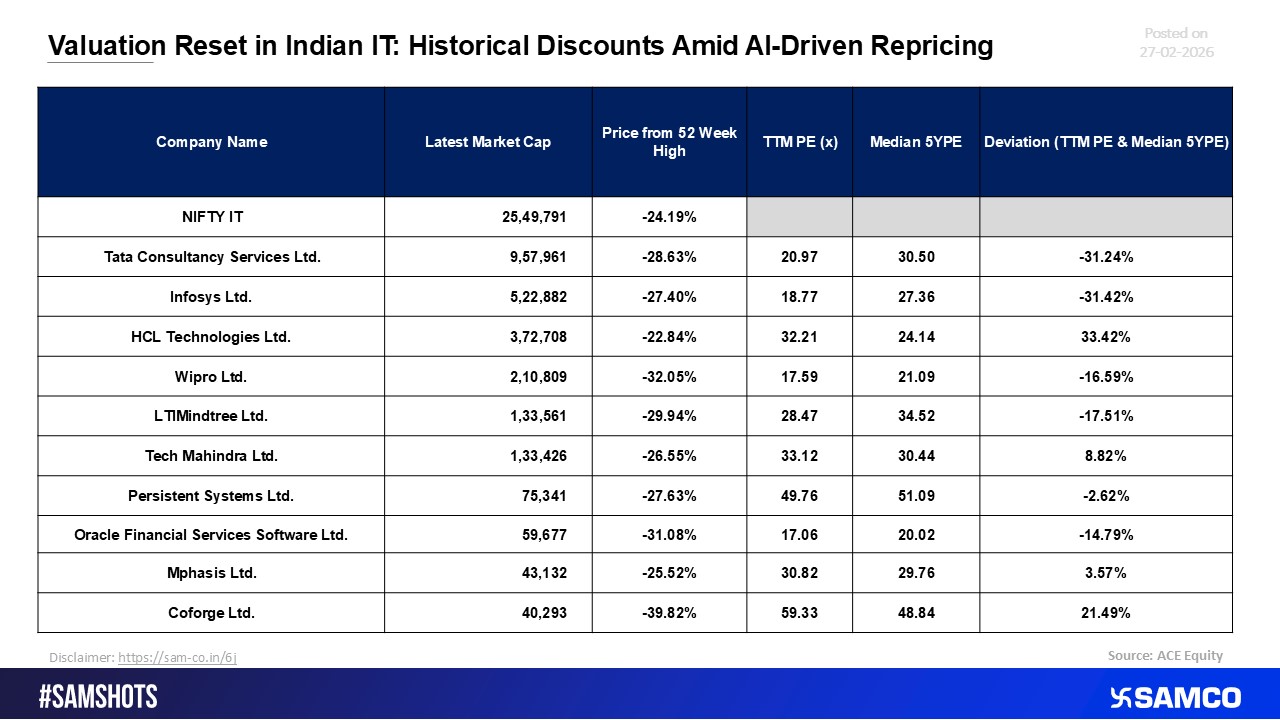
Structural Valuation Reset in Indian IT Following AI-Focused Reassessment
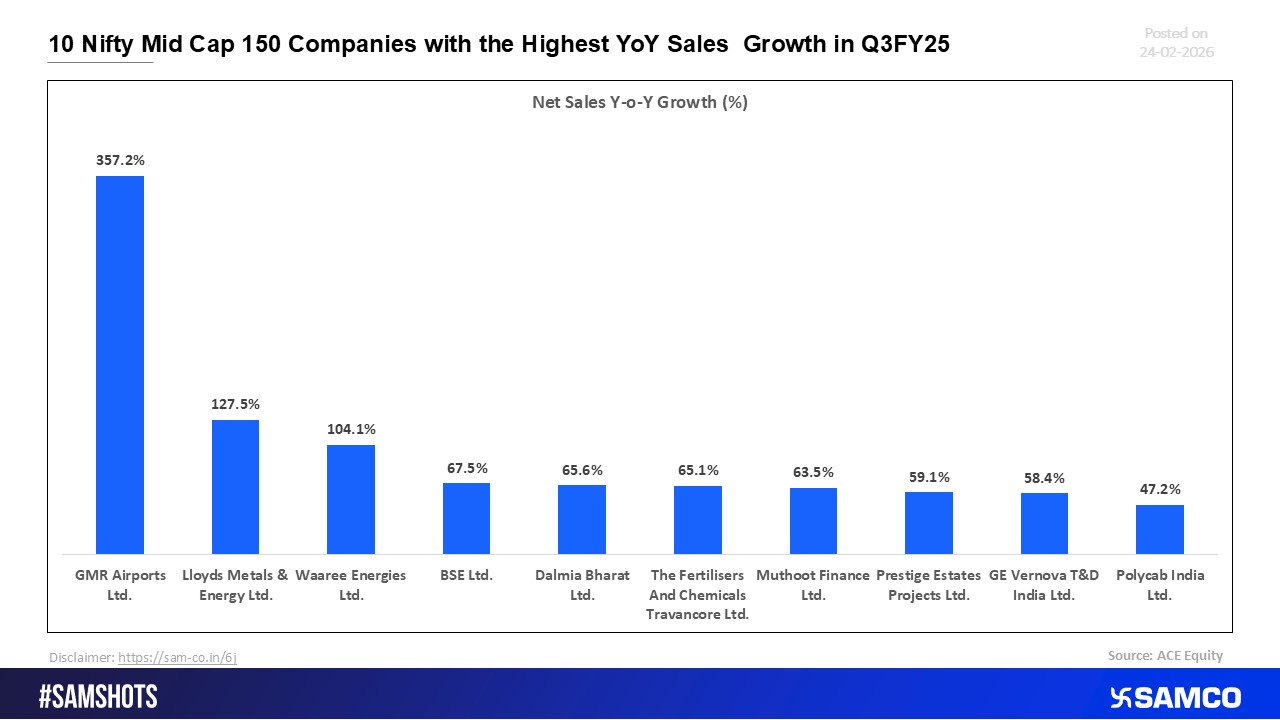
Nifty Midcap 150: Ten Fastest-Growing Companies by Q3FY25 Sales Growth
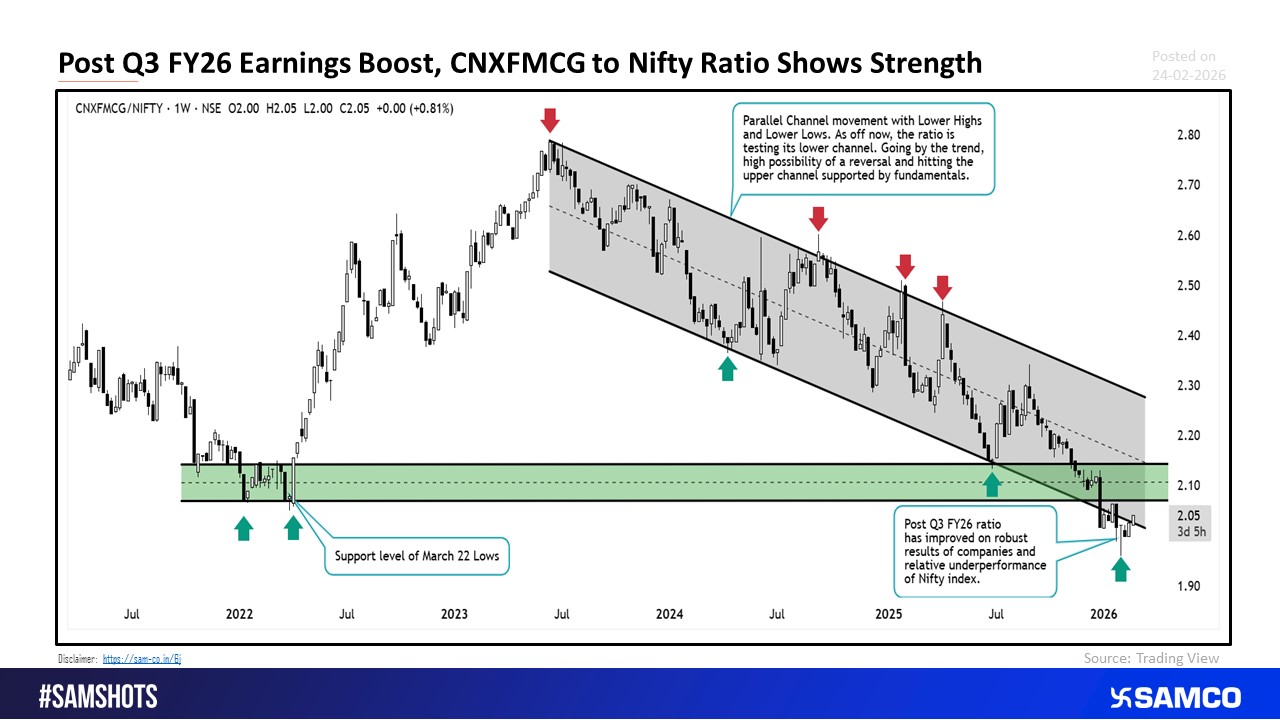
FMCG and NIFTY Ratio Chart Suggest a Reversal Post Strong Q3 FY26 Results
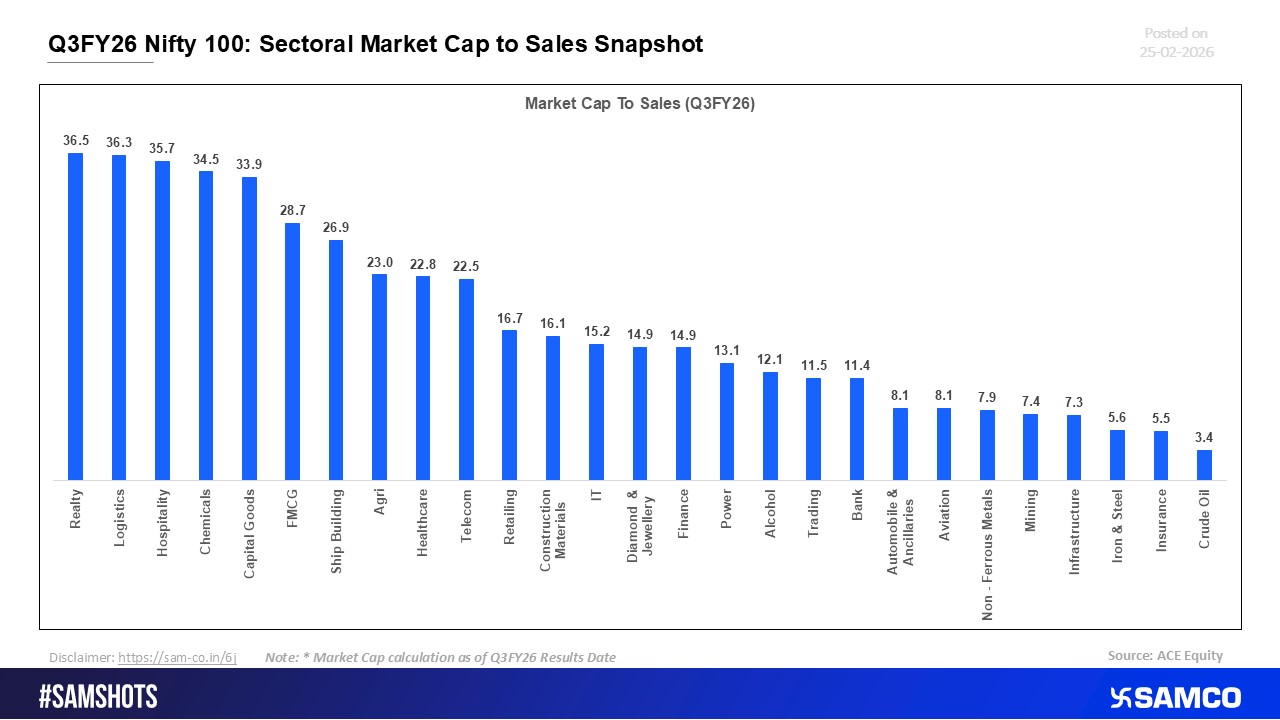
Nifty 100 Q3FY26: Sector-wise Market Cap-to-Sales Overview
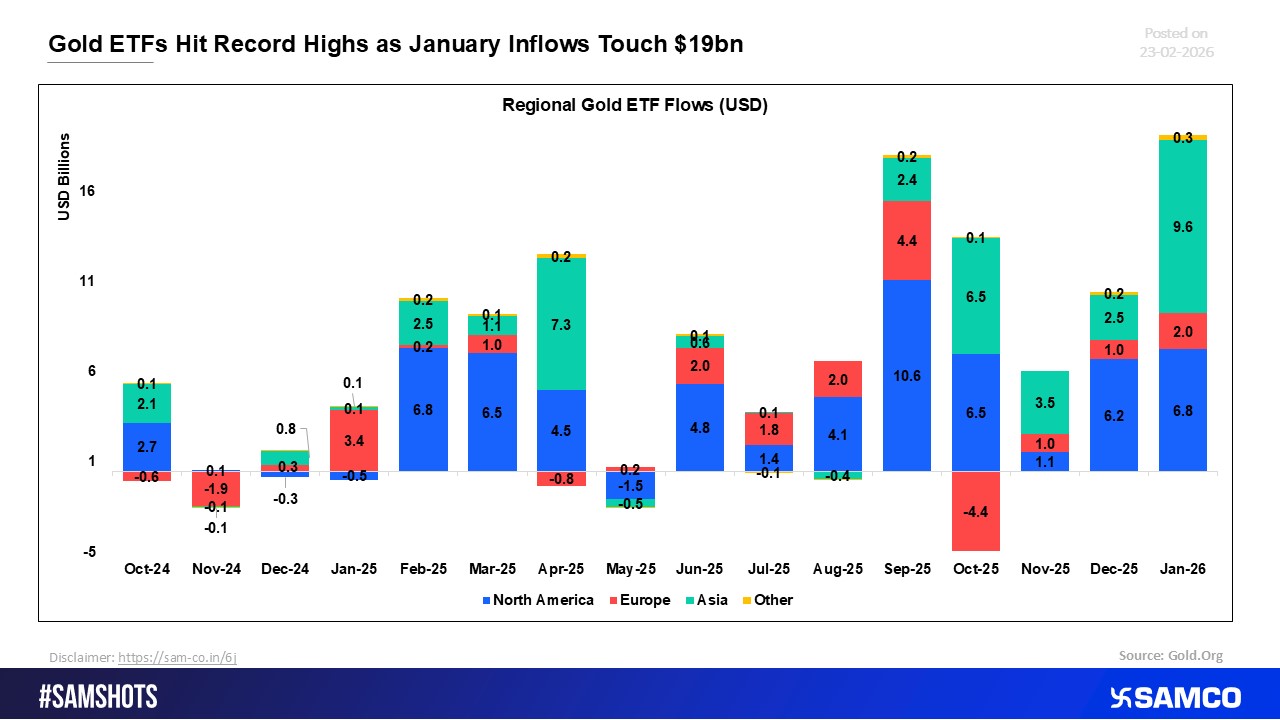
Gold ETFs Scale New Peaks as January Draws in $19Bn
The below chart shows the which sector witnessed the increase or decreased in FPI portfolio weightage in the latest fortnight.
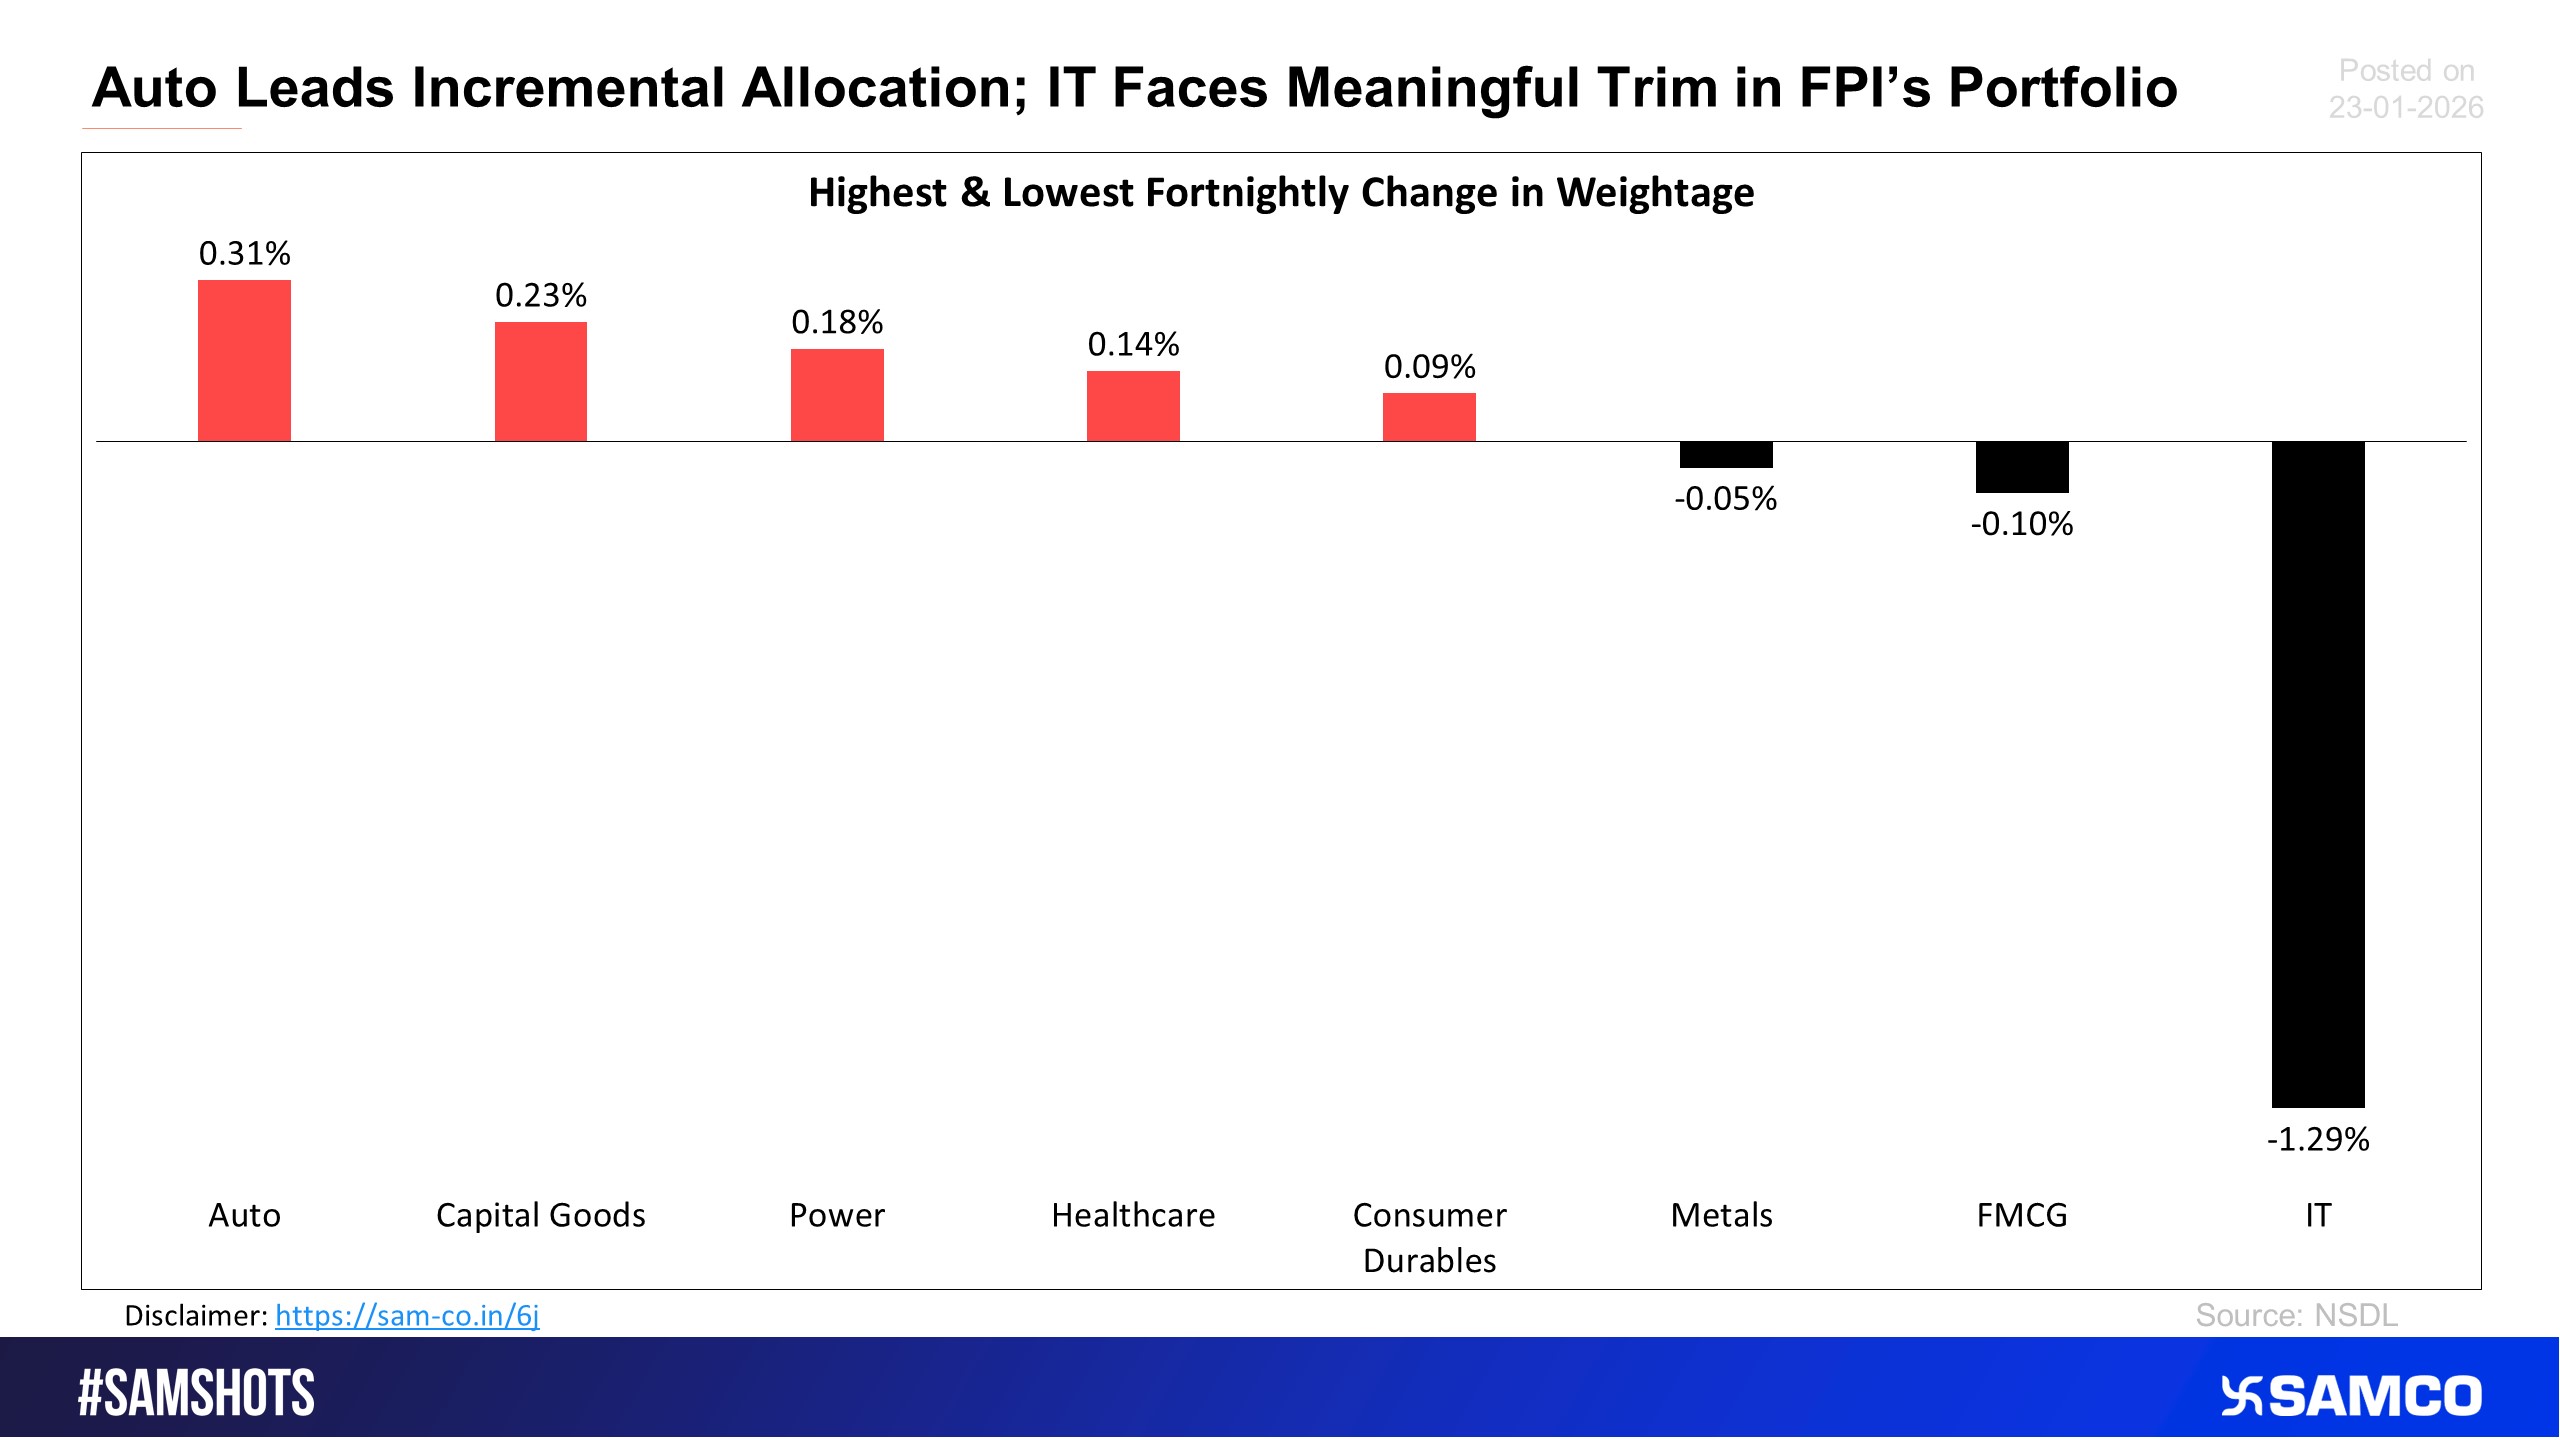
The given snapshot gives insight about the FPI portfolio change in the latest fortnight.
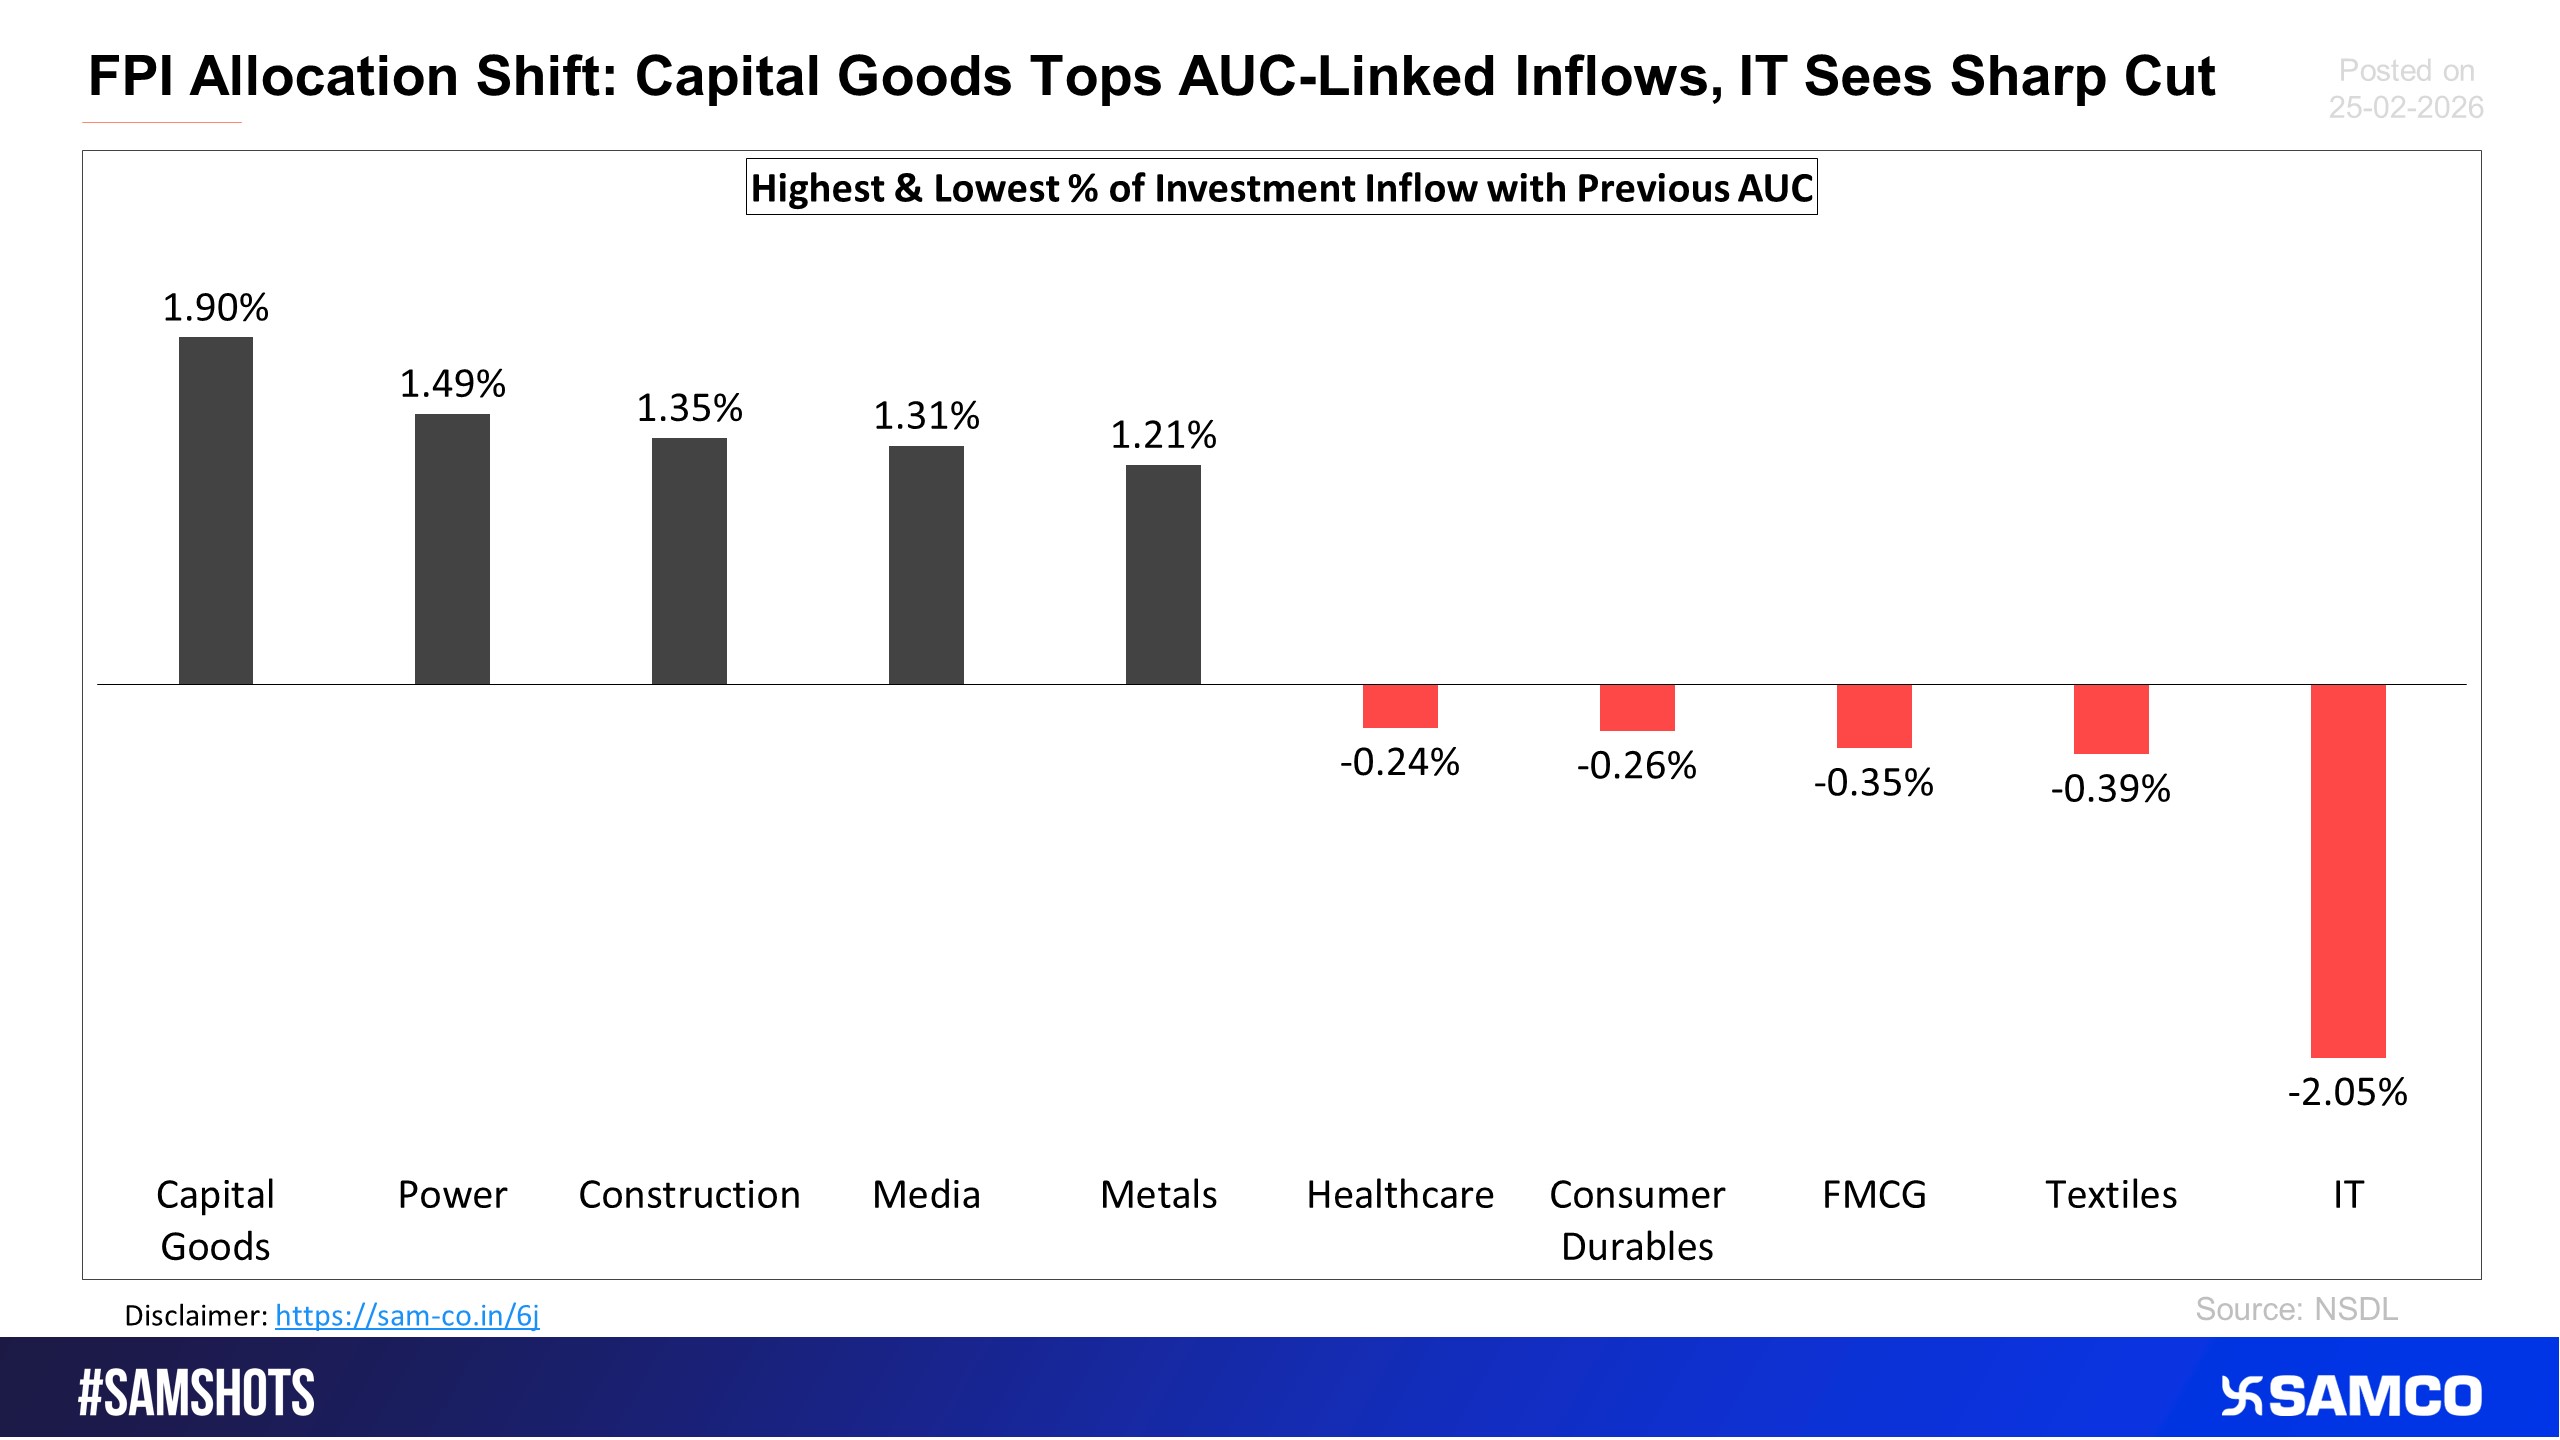
Here the sectoral inflow and outflow of the FPI during the period 1st Feb 2026 to 15th Feb 2026.
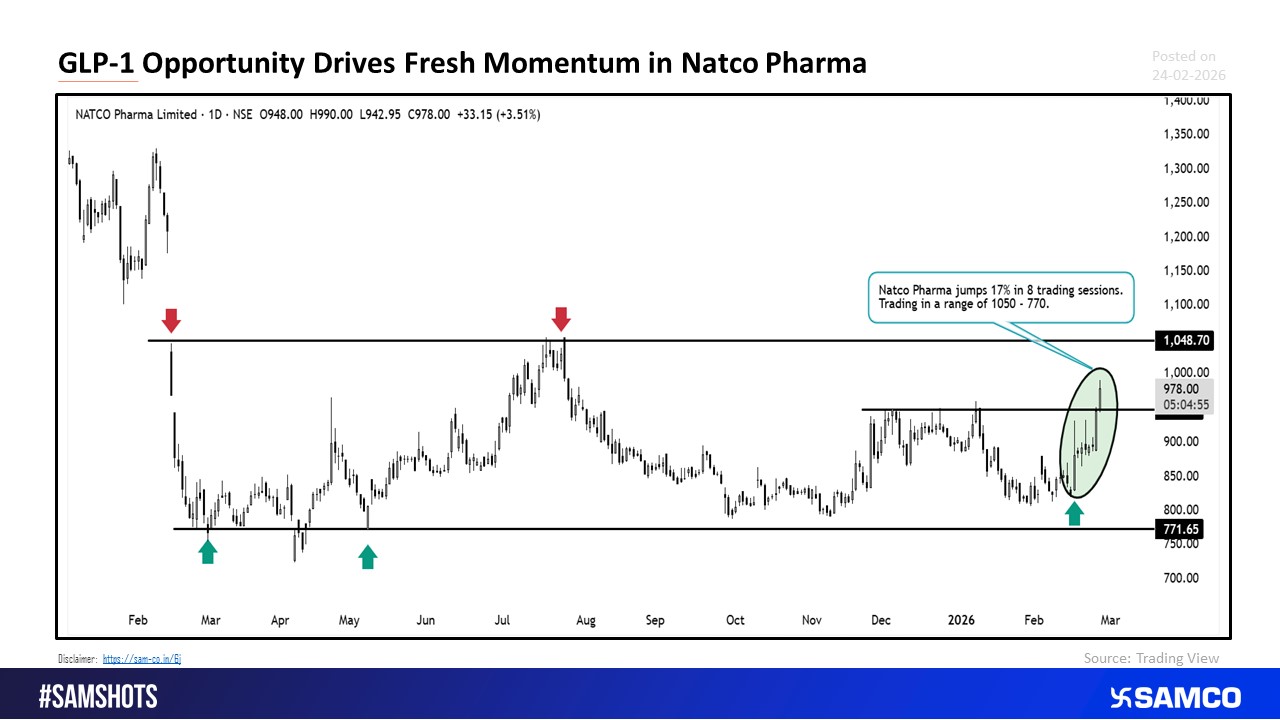
Natco Pharma Rallies 17% in 8 Trading Sessions on GLP opportunity
Food for Thought


 Easy & quick
1. Register on SCORES portal
2. Mandatory details for filling complaints on SCORES
Name | PAN | Address | Mobile | Number | E-mail ID
3. Benefits
Effective Communication
Speedy redressal of the grievances
