There are 2 kinds of charts available for technical analysis in the SAMCO NEST Trader – Intraday Charts and Historical Charts. For intraday charts, check our article on How to check Intraday charts in SAMCO NEST Trader.
This article answers the question of how to view historical charts in the NEST Trader?
In the SAMCO NEST Trader, a trader can get access to historical chart for several years. This is of great utility for positional trading and technical analysis. This facility is provided under NEST Plus Charting service and clients need to be registered with the Nest Plus service for accessing these charts. Since the registration process is a one time process, in case clients are already registered, there is no requirement for re-registration.
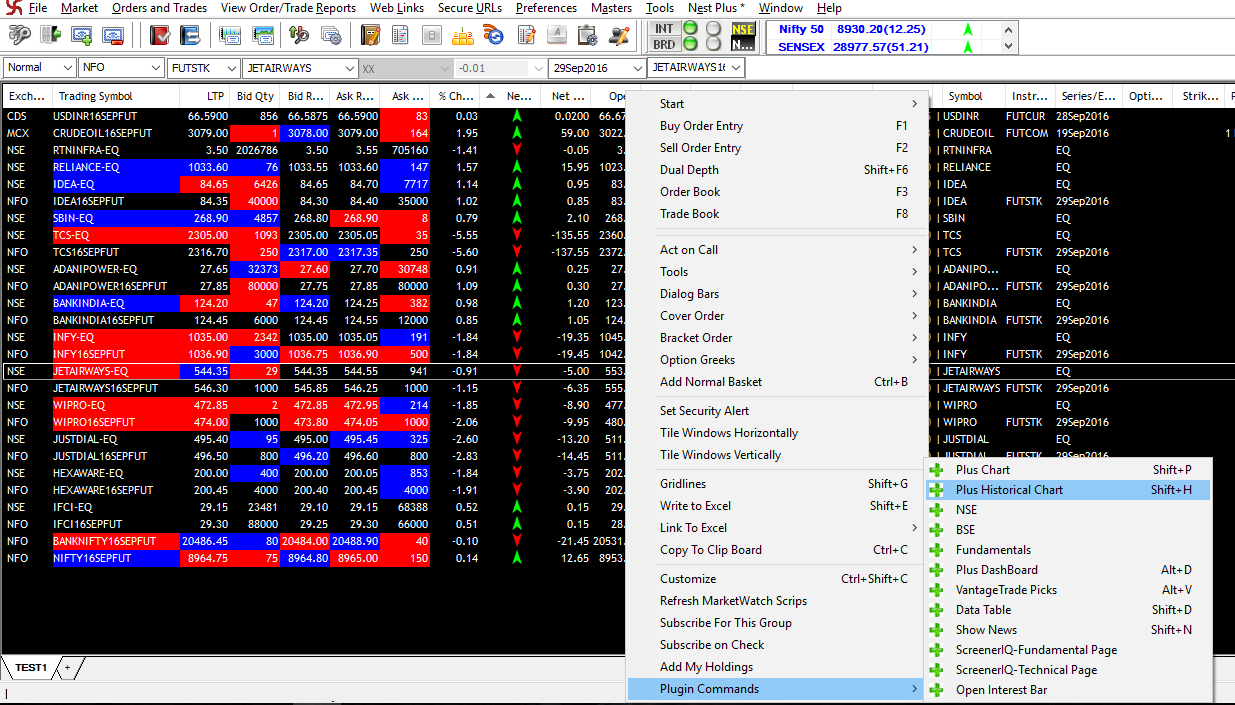
To get historical charts for a scrip, move the cursor to the scrip, right click and select the last option i.e. “Plugin Commands”. After this select the 2nd option “Plus Historical Chart”. The short cut key for invoking the historical chart directly is “Shift + H”
This shall invoke the historical chart for that particular scrip.
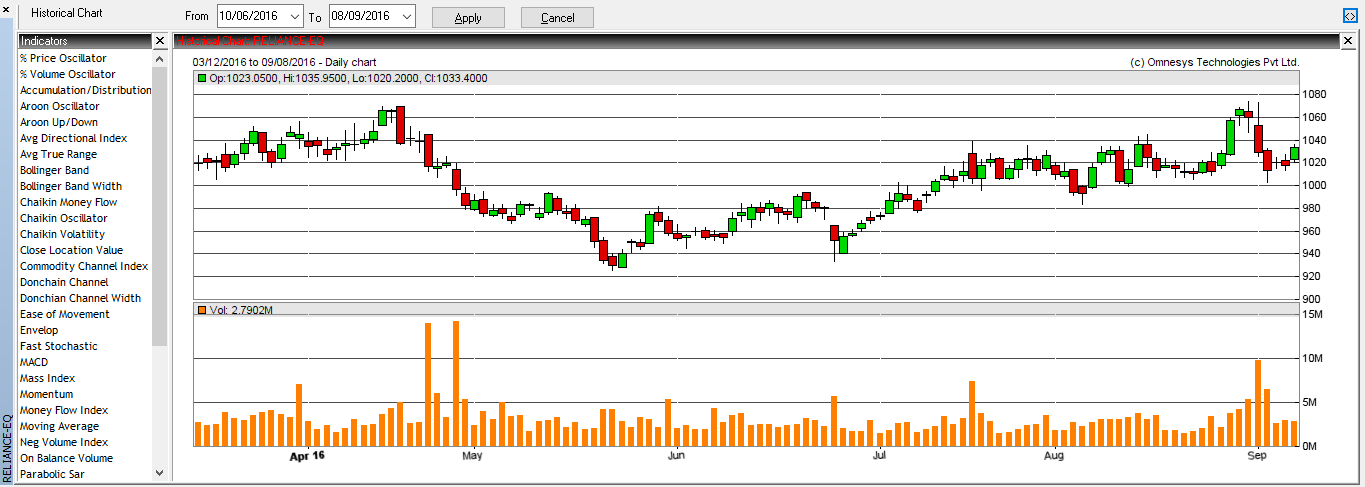
It shall also have the volume panel below the chart. On top, there is a date option also available, using which one can select the from and to date for the charts. In the SAMCO NEST Trader, historical charts are available for more than 15 years.
Additional Reference Links

 Easy & quick
Leave A Comment?