

In this article, we will cover
- Bollinger Bands Explained
- Bollinger Bands Formula
- Interpretation of Bollinger Bands
- How to use Bollinger Bands in trading?
- How to use for Short, Medium & Long Term Trades
Bollinger Bands Explained
There are many indicators which are visually simple to understand and require least efforts to interpret them correctly. However Bollinger band is one such indicator which requires through understanding on how to use it profitably. Bollinger Band was developed by John Bollinger who worked at Financial News Network’s Chief Technical Analyst in the mid 80s. It is an envelope in the form of two lines, which surrounds the price bars on a chart. Bollinger bands are plotted with two standard deviations away from a simple moving average. This is the primary difference between Bollinger bands and other envelope style indicators, where in the envelope indicators uses fixed percentage above and below simple moving average, but Bollinger band uses standard deviation which is dynamic and adjusts to the market volatility. The band grows wider during volatile market periods and narrow during less volatile periods.Bollinger Bands Formula
Upper Bollinger Band = N Day Simple Moving Average (Usually 20 Day SMA) + 2*Standard Deviation of prices Lower Bollinger Band = N Day Simple Moving Average (Usually 20 Day SMA) - 2*Standard Deviation of prices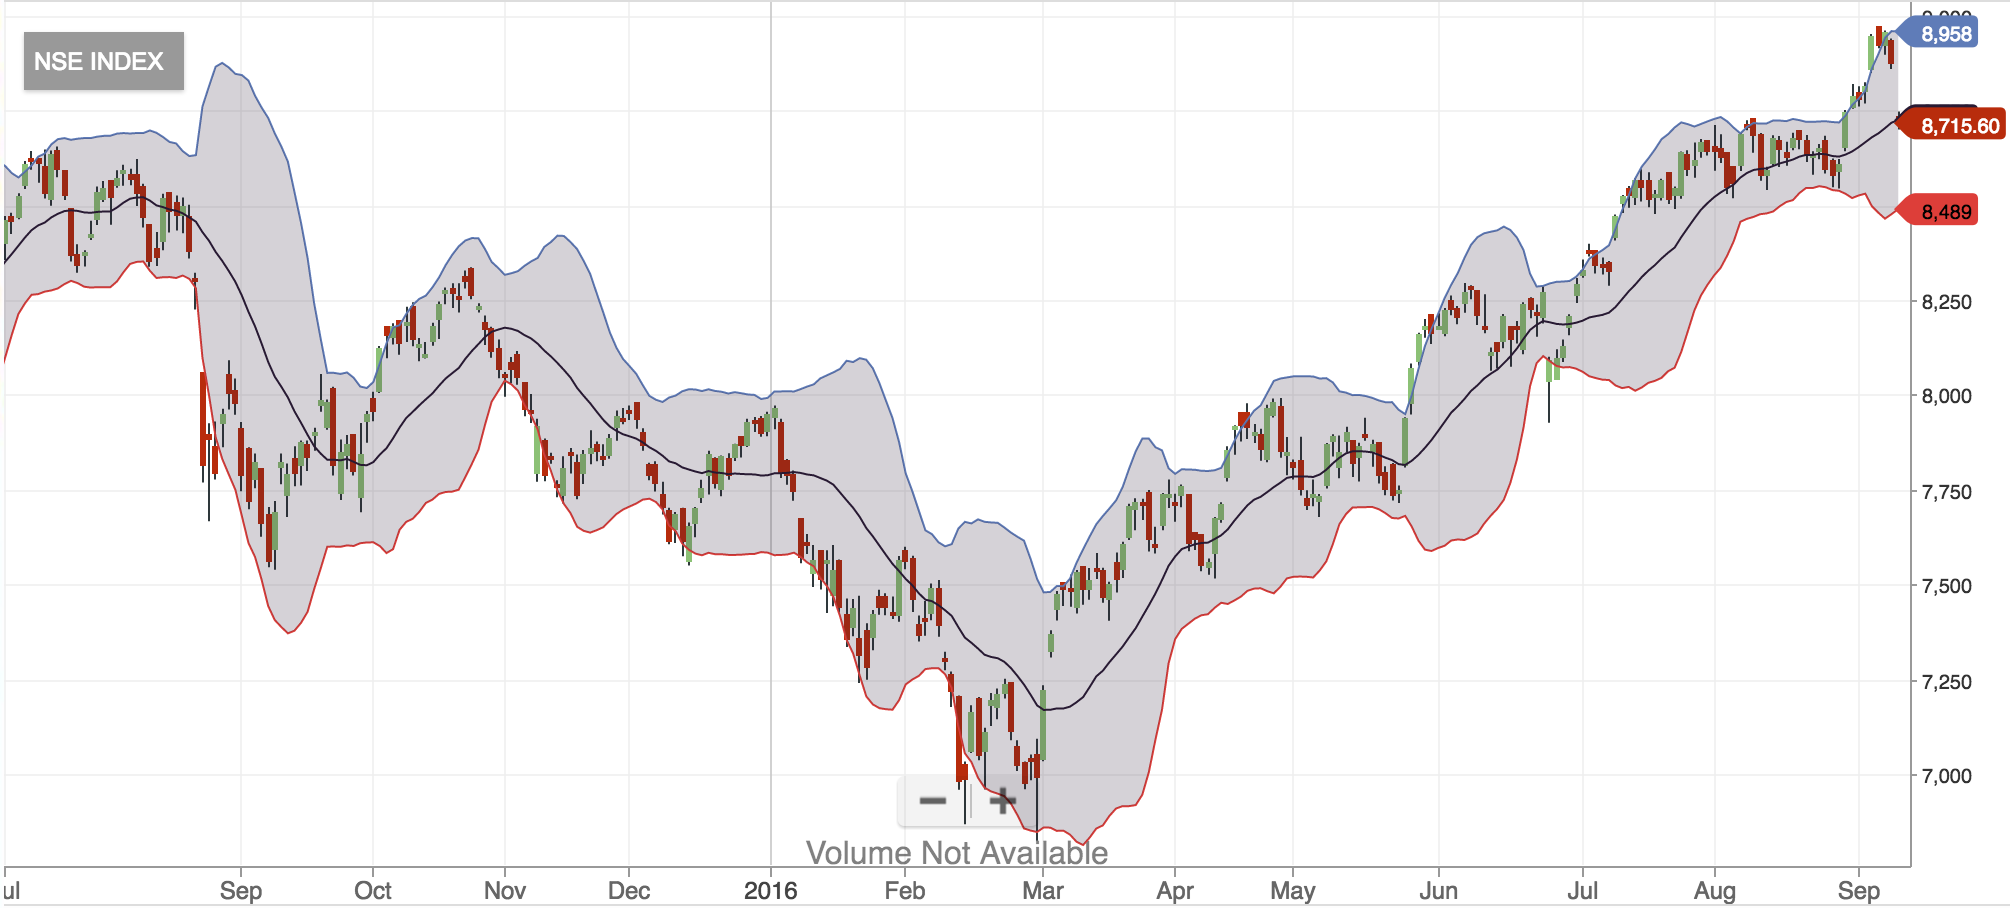 In the chart above the blue line in the envelope is the upper bollinger band and the red line in the envelope is the lower bollinger band. The black line is the median line.
Interpretation of Bollinger Bands
When the CMP of a stock is close to its upper bollinger band, it is an indication of an overbought market and when the CMP of a stock is close to its lower bollinger band, it is an indication of an oversold market. The objective of the Bollinger Bands indicator is giving the terms HIGH and LOW a relative definition. Prices are relatively high at the Upper Bollinger Band and relatively low at the Lower Bollinger Band.How to use Bollinger Bands in trading?
Bollinger Bands do not generate buy or sell signal on its own reliably, it has to be used with other indicators such as Relative Strength Index (RSI) or chart patterns. When prices touch one of the bands it can indicate a continuation of the trend or may reverse. RSI is an excellent indicator with respect to overbought or oversold conditions. When prices touch the upper Bollinger band and RSI is below 70, it is an indication that the trend will continue. However if price touches upper Bollinger band and RSI is above 70 possibly approaching 80 the trend may reverse and decline.How to use Bollinger Bands for short medium and long term trades? Making the Period Adjustment
The bands are plotted with 2 standard deviations from simple moving average. For short term trades a moving average of 10 days is more appropriate. For intermediate trend simple moving average of 20 days and for long term trades simple moving average of 50 days would be more appropriate to ride the long term trend. Traders should adjust the period of the bands depending on the tenure of their trading strategies. [caption id="attachment_765" align="aligncenter" width="1303"]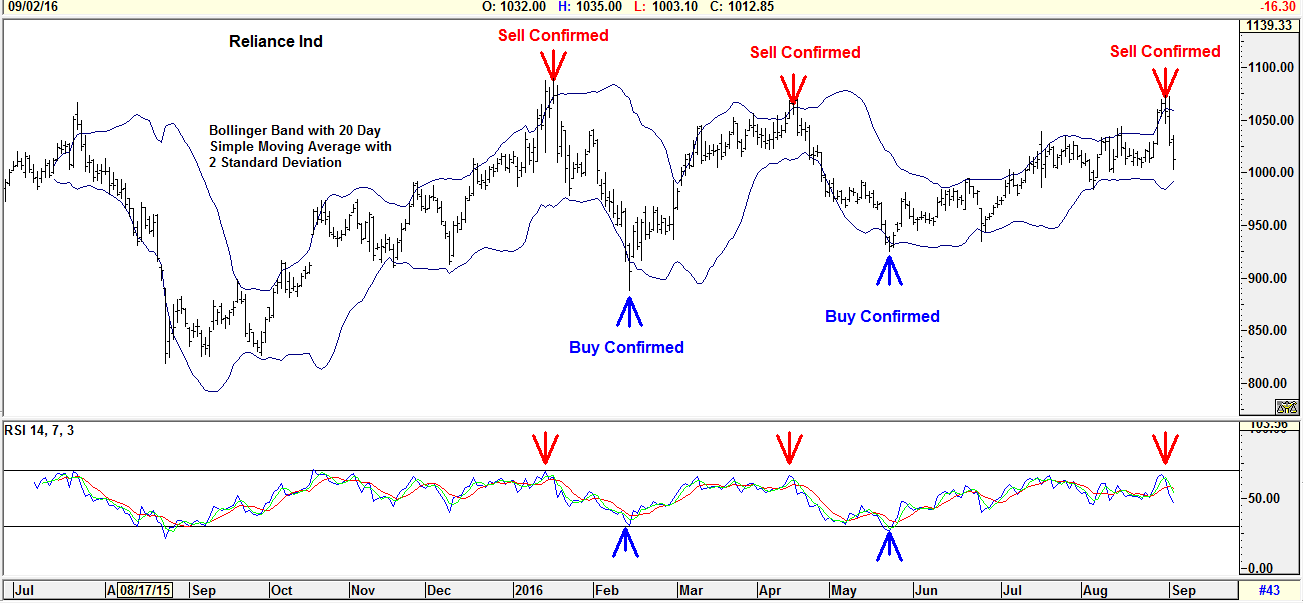 Using Bollinger Bands in Trading[/caption]
Conclusion
Indicators are very powerful but they have to be used in the proper context without which the utility of the indicator diminishes. While trading or investing it is essential to keep the big picture in mind, indicators like Bollinger Bands and RSI play a vital role in understanding that Big picture. Additional Reference Articles Watch our video on How to Find Tops and Bottoms? | How to Identify Highs and Lows with Bollinger Bands Trading?


 Easy & quick
Leave A Comment?