

The MACD (Moving Average Convergence Divergence) is one of the most widely used indicators in technical analysis. It helps traders understand momentum direction, trend strength, and potential turning points using moving average crossovers.
Because MACD blends trend-following and momentum concepts into a single indicator, it is commonly used by intraday traders, swing traders, and positional investors. Whether markets are trending or transitioning, MACD offers valuable insight into how price momentum is evolving.
This guide explains MACD from the ground up—its structure, logic, interpretation, and trading strategies—making it suitable for both beginners and intermediate traders.
What is MACD (Moving Average Convergence Divergence)?
MACD is a momentum-based technical analysis indicator that measures the relationship between two exponential moving averages of price.
Core Concept of MACD
MACD is designed to identify:
- Changes in momentum
- Shifts in trend direction
- Strength or weakness behind price movements
Instead of reacting to price alone, MACD evaluates how price is behaving relative to its recent average, which makes it more informative than simple moving averages.
MACD Formula
The MACD calculation is straightforward:
MACD Line = 12-period EMA – 26-period EMA
From this calculation:
- A signal line is derived
- A histogram is plotted to represent momentum changes
Why Traders Prefer MACD
- Simple to understand and apply
- Works across markets and timeframes
- Combines trend and momentum in one indicator
- Helps reduce emotional trading decisions
This versatility makes MACD a cornerstone of MACD technical analysis.
Key Components of MACD
MACD consists of three elements, each serving a distinct analytical purpose.
MACD Line
The MACD line reflects the difference between short-term and long-term price momentum.
- A rising MACD line indicates strengthening upward momentum
- A falling MACD line signals increasing downside momentum
Signal Line
The signal line is a 9-period EMA of the MACD line.
- It smoothens MACD fluctuations
- It helps identify potential trade signals through crossovers
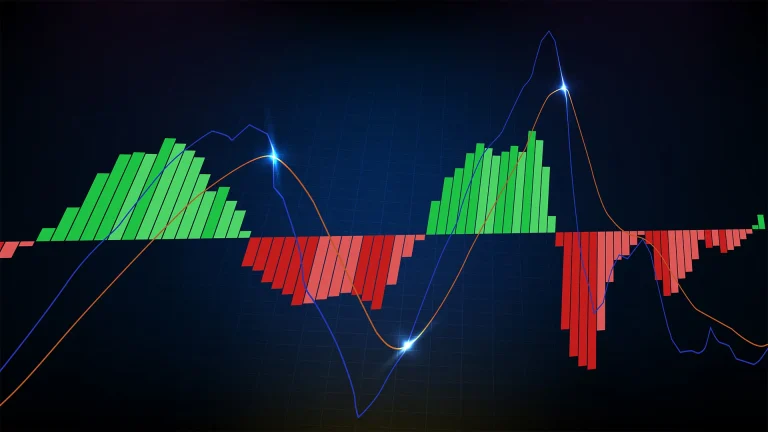
MACD Histogram
The histogram represents the distance between the MACD line and the signal line.
- Expanding histogram shows accelerating momentum
- Contracting histogram indicates slowing momentum
Many traders consider the histogram an early warning system for momentum shifts.
How the MACD Indicator Works
MACD works on the principle of convergence and divergence.
- When the two EMAs move closer, momentum is slowing
- When the two EMAs move apart, momentum is strengthening
These changes are reflected through:
- Line crossovers
- Zero-line positioning
- Histogram expansion or contraction
This makes MACD an effective moving average crossover indicator with added momentum context.
Types of Moving Average Crossovers in MACD
MACD Line and Signal Line Crossover
This is the most commonly used MACD signal.
- Bullish crossover: MACD line crosses above the signal line
- Bearish crossover: MACD line crosses below the signal line
These signals work best when aligned with the broader trend.
Zero-Line Crossover
The zero line represents the point where short-term and long-term momentum are equal.
- MACD above zero indicates bullish trend bias
- MACD below zero suggests bearish trend bias
Zero-line crossovers are often used for trend confirmation rather than early entries.
MACD Histogram – What It Means
The MACD Histogram shows the strength and direction of momentum.
- Rising histogram bars indicate increasing momentum
- Falling bars suggest weakening momentum
- A change in histogram direction often precedes line crossovers
Traders who focus on momentum shifts often rely more on the histogram than on crossovers alone.
How to Use MACD for Technical Analysis
MACD technical analysis becomes effective when it is used as a confirmation tool, not a standalone signal generator.
Trend Identification
- MACD staying above zero confirms bullish momentum
- MACD staying below zero confirms bearish momentum
Entry and Exit Signals
- Crossovers near key market levels improve reliability
- Histogram contraction can signal early exit conditions
Momentum Confirmation
MACD helps validate whether price movements have sufficient strength to sustain.
Popular MACD Trading Strategies
MACD Line and Signal Line Crossover Strategy
This strategy is suitable for:
- Swing trades
- Medium-term trend-following setups
Trades are taken when the crossover aligns with the prevailing trend direction.
MACD Zero-Line Crossover Strategy
Used primarily for:
- Trend continuation trades
- Positional trading setups
This approach helps avoid counter-trend trades.
MACD Divergence Strategy
One of the most powerful MACD-based techniques:
- Bullish divergence suggests downside momentum is weakening
- Bearish divergence indicates fading upside momentum
MACD and RSI Combination
MACD confirms trend and momentum, while RSI helps identify stretched price conditions. This combination improves trade timing.
MACD Divergence Explained
Bullish Divergence
Occurs when:
- Price makes lower lows
- MACD makes higher lows
This signals that downside momentum is weakening and a reversal may follow.
Bearish Divergence
Occurs when:
- Price makes higher highs
- MACD makes lower highs
This often appears near potential market tops.
MACD vs Other Technical Indicators
- MACD vs RSI: MACD focuses on momentum direction, RSI highlights overbought and oversold conditions
- MACD vs Moving Averages: MACD is more responsive to momentum changes
- MACD vs Stochastic: MACD performs better in trending markets
MACD works best when markets show directional clarity.
Advantages of MACD Indicator
- Applicable across multiple timeframes
- Combines trend and momentum analysis
- Clear visual interpretation
- Suitable for beginners and experienced traders
Limitations of MACD
- Lagging nature may delay signals
- Can generate false signals in sideways markets
- Less effective during sudden volatility spikes
Understanding these limitations helps traders use MACD more effectively.
Best Timeframes to Use MACD
- Intraday trading: 5-minute and 15-minute charts
- Swing trading: Daily charts
- Long-term investing: Weekly charts
The standard MACD settings perform well across most timeframes.
Tips to Use MACD Like a Professional Trader
- Avoid relying on MACD alone
- Always align signals with trend direction
- Pay close attention to histogram behavior
- Combine MACD with market context
- Backtest strategies before live execution
FAQs
What does MACD stand for?
Moving Average Convergence Divergence.
What does a MACD crossover mean?
It indicates a potential change in momentum direction.
How is MACD calculated?
By subtracting the 26-period EMA from the 12-period EMA.
Is MACD good for intraday trading?
Yes, when used with trend confirmation.
What is a good MACD setting?
The default 12, 26, 9 works for most traders.
What is the difference between MACD and RSI?
MACD tracks momentum trends, RSI tracks price extremes.
What does a rising MACD histogram indicate?
Increasing momentum strength.
Conclusion
MACD is a powerful indicator for understanding momentum shifts, trend direction, and crossover signals. It helps traders identify opportunities, confirm trends, and avoid emotionally driven decisions.
While MACD is effective on its own, it performs best when combined with broader market context and disciplined risk management. For traders aiming to build a strong technical analysis foundation, mastering MACD remains essential.


 Easy & quick