


What is Valuation Breadth?
Valuation breadth measures how widely expensive or cheap stocks are distributed across the market, rather than focusing only on index averages.
This chart tracks valuation dispersion in the Nifty 500 since January 2020, segmented into:
- Large Caps (Nifty 100)
- SMIDs (Small & Midcaps)
It classifies stocks into different P/E and P/B valuation bands, showing whether most stocks are trading at low, fair, or stretched multiples.
Markets tend to turn not when averages peak, but when breadth extremes appear.
When Markets Peak: Elevated Valuation Concentration
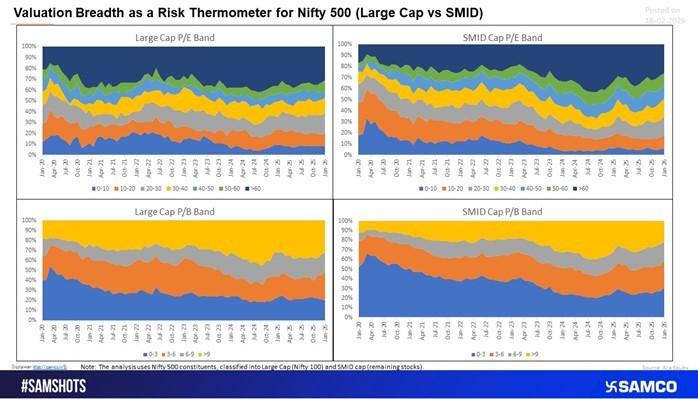
A textbook example occurred in September 2024:
- Both Large Caps and SMIDs showed a sharp rise in stocks trading at high P/E and high P/B multiples.
- Valuation clustering at upper bands reflected crowded positioning.
- Margin of safety narrowed across the board.
This broad valuation expansion coincided with a market peak, followed by correction and consolidation through February 2025 as earnings caught up with price expectations.
Key Insight:
When too many stocks trade at elevated multiples simultaneously, risk rises, even if earnings remain stable.
When Markets Bottom: Broad Valuation Compression?
Contrast this with March 2020:
- Sharp spike in low P/E and low P/B buckets.
- Panic-driven selloff compressed valuations across quality names.
- Strong businesses became available at deep discounts.
This “premium at discount” phase marked a durable market bottom.
Key Insight:
When valuation compression is widespread, opportunity improves, especially in fundamentally strong stocks.
Large Caps vs SMIDs: What Breadth Tells Us
- Large Caps: Valuation shifts tend to be gradual, reflecting institutional flows and earnings visibility.
- SMIDs: More volatile — valuation expansions and compressions happen faster and are often sentiment-driven.
Peaks become more fragile when both segments simultaneously crowd into higher valuation bands.
Why Valuation Breadth Matters More Than Averages?
Index-level P/E or P/B can remain elevated for extended periods. However:
- If breadth continues expanding → rally can sustain.
- If breadth narrows while valuations remain high → risk increases.
Extremes matter more than averages.
Valuation breadth acts as a risk thermometer:
- Broad low valuations = Opportunity regime
- Broad high valuations = Caution regime
Investor Takeaways
- Monitor how many stocks are in extreme valuation buckets.
- Peaks often form when participation narrows but valuations stay stretched.
- Durable bottoms form when panic compresses valuations across segments.
- Breadth analysis improves risk management beyond headline index multiples.
Strategic Framework
Regime | Valuation Breadth Signal | Strategy Bias |
Broad Compression | Majority in low P/E & P/B bands | Accumulate quality |
Expanding Fair Value | Balanced distribution | Selective buying |
Crowded High Valuation | Majority in top bands | Reduce risk / Rotate |
Narrowing Breadth at High Valuations | Early warning signal | Defensive positioning |


 Easy & quick
Leave A Comment?