
Foreign Portfolio Investors (FPIs) displayed a cautious but positive shift toward Indian equities during the fortnight of 16–28 February 2026. Despite global economic uncertainties and intermittent market volatility, FPIs turned net buyers with an inflow of ₹2,940 crore, indicating renewed confidence in selective sectors of the Indian market.
However, the allocation pattern reveals a clear sectoral rotation, with investors moving capital toward capex-driven and domestic cyclical sectors while reducing exposure to consumption and export-oriented industries.
![]()
Strong FPI Inflows into Capex-Driven Sectors
The latest sectoral flow data highlights strong investor conviction in sectors that benefit from India’s infrastructure and manufacturing expansion.
Top sectors receiving FPI inflows
- Capital Goods: ₹4,103 crore
- Auto: ₹3,075 crore
- Construction: ₹2,742 crore
- Metals & Mining: ₹2,359 crore
- Financial Services: ₹2,243 crore
Among these, Capital Goods emerged as the biggest beneficiary, reflecting investor confidence in India’s long-term infrastructure and industrial growth story.
Why these sectors are attracting capital?
Several structural factors are driving FPI interest:
- Government infrastructure spending
- Strong order books for industrial companies
- Increasing manufacturing activity
- Improving rural demand supporting auto sales
From a technical perspective, many of these sectors have held key support levels during market consolidation, showing relative strength compared to the broader market.
IT and Consumer Services Witness Heavy Outflows
While cyclicals gained traction, several sectors experienced significant FPI outflows.
Major sectors seeing outflows
- Consumer Services: ₹5,238 crore outflow
- Information Technology: ₹5,993 crore outflow
- Telecom: ₹1,775 crore outflow
- FMCG: ₹769 crore outflow
- Chemicals: ₹394 crore outflow
The sharp outflows suggest investors are reducing exposure to expensive sectors with slowing earnings growth.
Reasons behind the selloff
Several macro and fundamental factors likely contributed:
- Elevated valuations after previous rallies
- Muted earnings guidance in recent quarters
- A strong US dollar impacting IT export margins
- Slower consumption growth in urban markets
This shift indicates that investors are becoming more selective and valuation-conscious.
AUC-Based Allocation: Where Conviction Is Highest
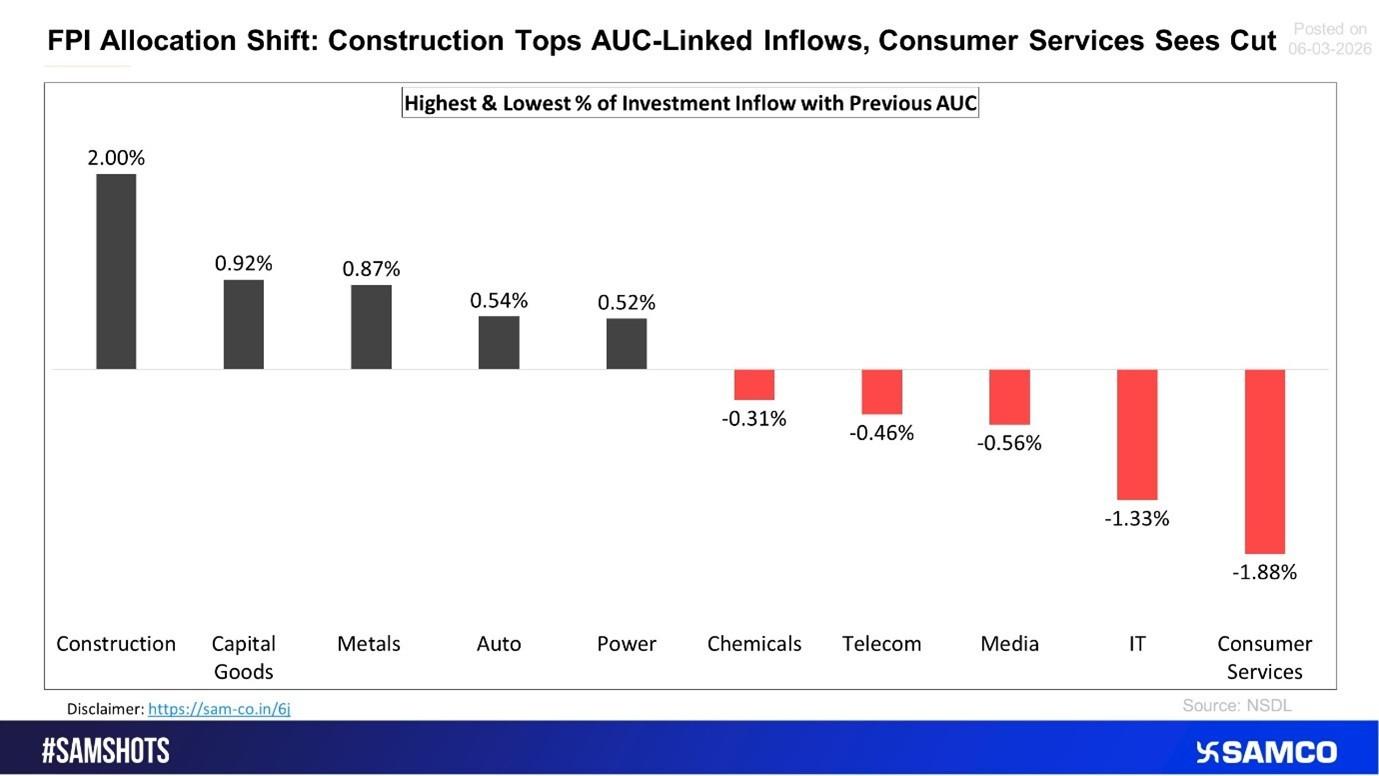
When analyzing FPI allocation relative to Assets Under Custody (AUC), the trend becomes even clearer.
Highest inflow shifts
- Construction: +2.00%
- Capital Goods: +0.92%
- Metals: +0.87%
- Auto: +0.54%
- Power: +0.52%
Construction stands out with the largest allocation increase, signaling strong investor conviction in India's infrastructure development.
Sectors facing the biggest allocation cuts
- Consumer Services: -1.88%
- IT: -1.33%
- Media: -0.56%
- Telecom: -0.46%
- Chemicals: -0.31%
This adjustment removes the impact of sector size and reveals where investors are actively increasing or reducing conviction.
Portfolio Weight Changes Reveal Long-Term Positioning
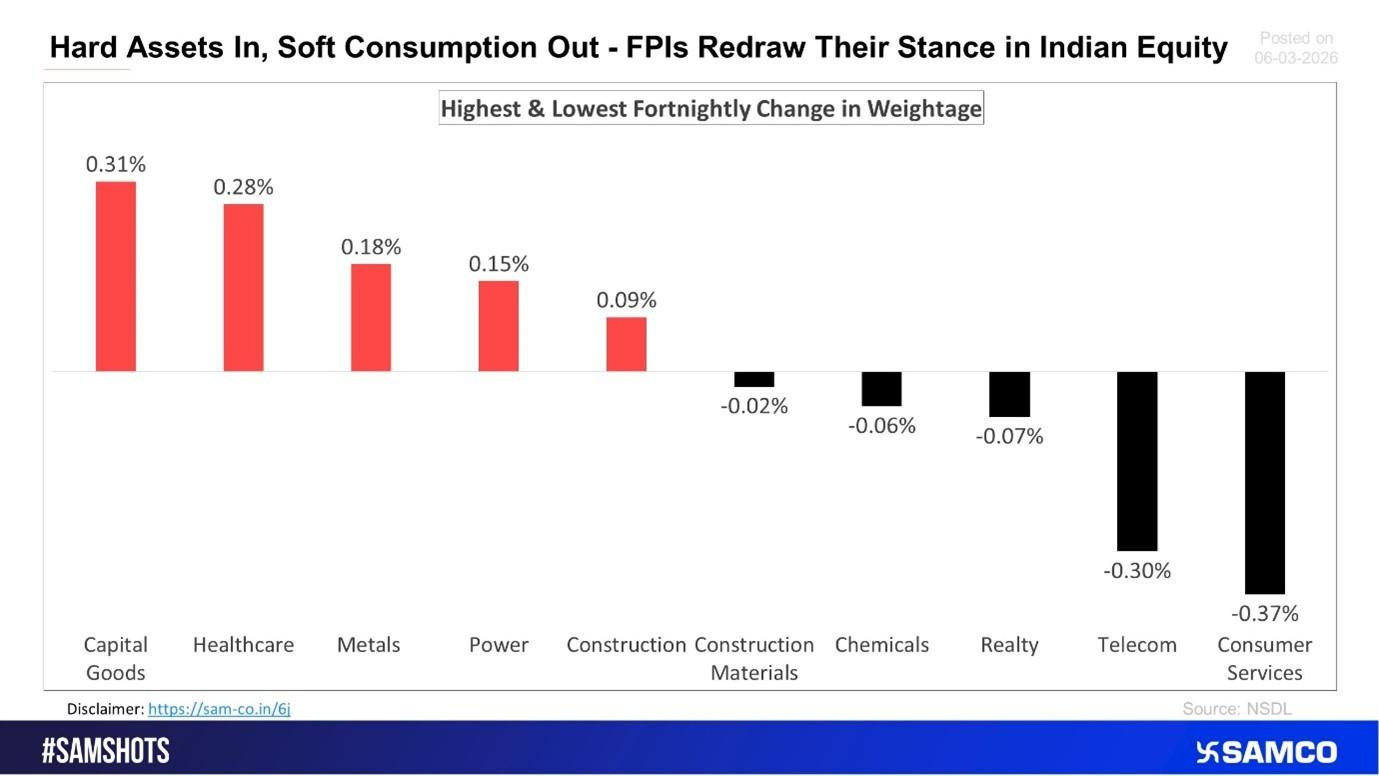
Another important indicator is the change in sector weight within FPI portfolios, which reflects longer-term positioning rather than short-term flows.
Sectors gaining portfolio weight
- Capital Goods: +0.31%
- Healthcare: +0.28%
- Metals: +0.18%
- Power: +0.15%
- Construction: +0.09%
Capital Goods again leads the list, reinforcing strong investor belief in India’s infrastructure and manufacturing expansion cycle.
Healthcare also saw notable interest, likely driven by:
- Rising pharmaceutical exports
- Increasing domestic healthcare spending
- Long-term growth prospects in the pharma industry
Sectors losing portfolio weight
- Consumer Services: -0.37%
- Telecom: -0.30%
- Realty: -0.07%
- Chemicals: -0.06%
- Construction Materials: -0.02%
Consumer Services remains the least favored sector, largely due to high valuations and slower consumption growth.
Sector Rotation Signals a Structural Investment Trend
The overall data indicates a clear rotation toward sectors tied to India’s physical and industrial growth.
Key themes emerging from FPI flows
1. Preference for capex-driven sectors
Infrastructure, construction, and capital goods are attracting strong institutional flows.
2. Shift away from expensive consumption sectors
High valuations and slower growth are prompting investors to trim positions.
3. Reduced exposure to export-linked sectors
Currency pressures and global uncertainties are affecting IT allocations.
4. Focus on domestic economic growth drivers
Sectors tied to manufacturing, infrastructure, and energy are gaining traction.
This pattern suggests the shift may be structural rather than just tactical.
What This Means for the Indian Stock Market?
The latest FPI allocation trend provides valuable insight into where institutional money expects the next earnings cycle to emerge.
Investors appear to be positioning for:
- Infrastructure expansion
- Manufacturing growth
- Rising domestic industrial demand
- Increased energy and power infrastructure
Meanwhile, sectors dependent on urban consumption or global demand are witnessing reduced investor interest.
Conclusion
The latest FPI sectoral flow data for February 2026 highlights a clear shift in investor strategy. Capital Goods, Auto, Construction, and Metals are attracting strong inflows as investors align with India's capex-driven economic growth story.
At the same time, sectors such as Consumer Services, IT, and Telecom are experiencing allocation cuts due to valuation concerns and slower earnings momentum.
Overall, the trend suggests FPIs are rebalancing portfolios toward sectors that build India’s economic infrastructure, offering a strong indication of where the next phase of earnings growth could emerge.


 Easy & quick
Leave A Comment?