

 Would you invest in a company just because they are making profits? Does making profit guarantee that the company is good for investment?
A balance sheet helps us understand how much debt a company holds. Whereas an Income Statement shows us how much profit it generates to become debt-free. For a potential investor, income statement helps to assess the company’s recent performance. Hence, stakeholders rely on this statement to understand the business operations.
Analysing an Income Statement is the best way to check how successful a company is. It reveals at what rate is the revenue growing. These factors play an important role in deciding whether to invest in a company or not.
Income Statement is also referred to as Profit & Loss statement. It records all the revenues and expenses. This statement shows a business’ performance over a year.
Would you invest in a company just because they are making profits? Does making profit guarantee that the company is good for investment?
A balance sheet helps us understand how much debt a company holds. Whereas an Income Statement shows us how much profit it generates to become debt-free. For a potential investor, income statement helps to assess the company’s recent performance. Hence, stakeholders rely on this statement to understand the business operations.
Analysing an Income Statement is the best way to check how successful a company is. It reveals at what rate is the revenue growing. These factors play an important role in deciding whether to invest in a company or not.
Income Statement is also referred to as Profit & Loss statement. It records all the revenues and expenses. This statement shows a business’ performance over a year.
 We learnt how to analyse a Balance Sheet in our previous article. Today, lets focus on how to read an Income Statement.
Here is Dabur India Limited’s Income Statement of 2019-20 -
We learnt how to analyse a Balance Sheet in our previous article. Today, lets focus on how to read an Income Statement.
Here is Dabur India Limited’s Income Statement of 2019-20 -
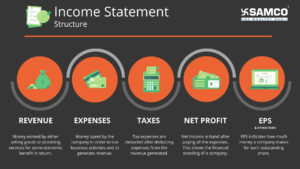
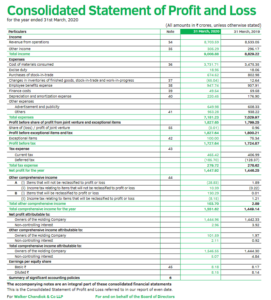 Let’s break this down and understand every line in this statement –
A) Income:
Let’s break this down and understand every line in this statement –
A) Income:
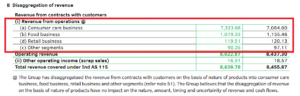
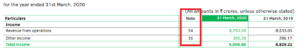 The income section is usually divided in 2 parts. Revenue from operations and other revenue. Let's observe these figures one-by-one.
- Revenue from Operations
 This makes analysing data easier and more useful.
- Other Income
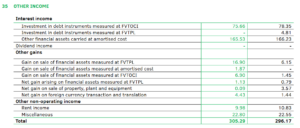 Interest income and gains or losses arising from various investments are recorded here. These incomes do not form a part of a company’s normal operation.
B) Expense:
These are funds spent on operations to keep generating revenue from business activities. It includes cash as well as non-cash expenses.
Here is Dabur India Limited’s expense head from its Income Statement -
Interest income and gains or losses arising from various investments are recorded here. These incomes do not form a part of a company’s normal operation.
B) Expense:
These are funds spent on operations to keep generating revenue from business activities. It includes cash as well as non-cash expenses.
Here is Dabur India Limited’s expense head from its Income Statement -
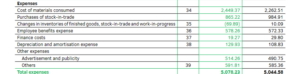
- Cost of Material Consumed
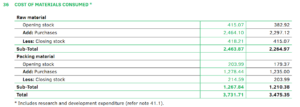 It is calculated as opening stock plus current-year purchases less the closing balance. Dabur India being an FMCG company, they incur packing expenses too. We can note the amount spent on each activity by observing this footnote.
- Finance Cost
- Depreciation and Amortisation
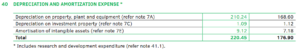 Dabur India’s depreciation expenses have increased by 24.62%. This reduces the net profit of the company which further reduces tax expenses.
C) Profit Before Tax (PBT) and Tax Expenses
Dabur India’s depreciation expenses have increased by 24.62%. This reduces the net profit of the company which further reduces tax expenses.
C) Profit Before Tax (PBT) and Tax Expenses
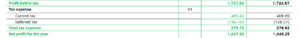 Profit Before Tax is the income on which tax is calculated. It is calculated after subtracting all the expenses from the revenue generated.
In our case, the profit before taxes and tax expenses shows no significant change. Let us have a look at its notes to accounts -
Profit Before Tax is the income on which tax is calculated. It is calculated after subtracting all the expenses from the revenue generated.
In our case, the profit before taxes and tax expenses shows no significant change. Let us have a look at its notes to accounts -
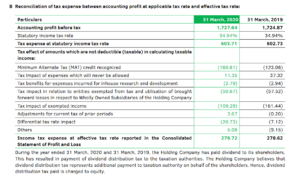
- Deferred Tax
- Minimum Alternative Tax (MAT) Credit Entitlement
 When net profit increases, retained earnings tend to increase. This is a positive sign. Retained earnings is a portion of the net profit which is reinvested in the business. It is good, because it means the company is staying profitable.
Recommended watch: You can use quarterly net profits to pick fundamentally strong stocks for swing trading.
We can calculate several ratios from an income statement. They reveal different information about the profitability of the business. For example, various profit margin ratios. This topic will be covered in our next article.
When net profit increases, retained earnings tend to increase. This is a positive sign. Retained earnings is a portion of the net profit which is reinvested in the business. It is good, because it means the company is staying profitable.
Recommended watch: You can use quarterly net profits to pick fundamentally strong stocks for swing trading.
We can calculate several ratios from an income statement. They reveal different information about the profitability of the business. For example, various profit margin ratios. This topic will be covered in our next article.
- Earnings Per Share (EPS)
 Earnings Per Share is one of the many indicators one needs to observe before investing. It indicates how much the company is earning per ordinary share. In our example, Dabur India Limited is earning Rs. 8.18 per share.
Related: Watch what are shares in Hindi?
EPS calculation from the footnotes -
Earnings Per Share is one of the many indicators one needs to observe before investing. It indicates how much the company is earning per ordinary share. In our example, Dabur India Limited is earning Rs. 8.18 per share.
Related: Watch what are shares in Hindi?
EPS calculation from the footnotes -
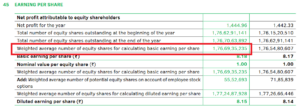 The company reports that 1,76,69,35,235 shares are outstanding in the market. We calculate EPS by dividing total profit after tax by the outstanding number of shares. In this case:
Rs. 1,447.92 crores divided by 1,76,69,35,235 yields Rs. 8.18 per share. A higher EPS indicates greater value.
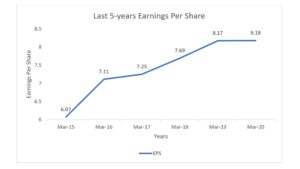
Observe this chart displaying last five years EPS trend –
The company reports that 1,76,69,35,235 shares are outstanding in the market. We calculate EPS by dividing total profit after tax by the outstanding number of shares. In this case:
Rs. 1,447.92 crores divided by 1,76,69,35,235 yields Rs. 8.18 per share. A higher EPS indicates greater value.
Observe this chart displaying last five years EPS trend –
| Year | March 2020 | March 2019 | March 2018 | March 2017 | March 2016 | March 2015 |
| EPS | 8.18 | 8.17 | 7.69 | 7.25 | 7.11 | 6.07 |
 End Note:
People generally form an opinion after checking the company's net profit. But a smart investor drills down the financial statements. You cannot judge a person based on his single quality. Likewise, the profitability alone can be deceiving.
Analyse the trends of the past years using profitability ratios. Understand and observe the change in revenue and expense items over time. Start tracking the company’s EPS. At what rate is it increasing or decreasing?
Income statement can help with the decision of whether to invest in the company or not. To learn more about how to become a better investor, visit our YouTube channel. Open a Demat account with SAMCO and start investing your money smarty!
Also Read:
How to Read an Annual Report of a Company
How to Read & Analyse a Balance Sheet of a Company – Dabur India Limited
How to Read & Analyse a Cash Flow Statement of a Company – Dabur India Limited
End Note:
People generally form an opinion after checking the company's net profit. But a smart investor drills down the financial statements. You cannot judge a person based on his single quality. Likewise, the profitability alone can be deceiving.
Analyse the trends of the past years using profitability ratios. Understand and observe the change in revenue and expense items over time. Start tracking the company’s EPS. At what rate is it increasing or decreasing?
Income statement can help with the decision of whether to invest in the company or not. To learn more about how to become a better investor, visit our YouTube channel. Open a Demat account with SAMCO and start investing your money smarty!
Also Read:
How to Read an Annual Report of a Company
How to Read & Analyse a Balance Sheet of a Company – Dabur India Limited
How to Read & Analyse a Cash Flow Statement of a Company – Dabur India Limited


 Easy & quick
Leave A Comment?