

If you've ever looked at a stock chart and wondered how traders identify trends so quickly, chances are they are using moving averages.
Moving averages are among the most popular and widely used tools in technical analysis. From beginners learning the basics of chart reading to professional traders managing large portfolios, moving averages help simplify price action and reveal the underlying direction of a stock.
They can help traders identify trends, spot potential reversals, find support and resistance zones, and improve trade timing.
In this guide, we'll explain what moving averages are, how they work, the difference between SMA and EMA, and how traders use them in real-world trading.
What is a Moving Average?
A moving average is a technical indicator that calculates the average price of a stock over a specific period.
Instead of focusing on every small price fluctuation, moving averages smooth out market noise and help traders see the broader trend.
As new price data becomes available, the average continuously updates or "moves," which is why it is called a moving average.
For example, a 20-day moving average calculates the average closing price of the last 20 trading sessions. Every day, the oldest data point is removed and the latest price is added.
This creates a smooth line on the chart that helps traders understand whether the stock is trending upward, downward, or moving sideways.
Why are Moving Averages Important?
Markets can be noisy.
A stock may move up one day, fall the next, and then rise again. Looking at individual candles can sometimes make it difficult to understand the bigger picture.
Moving averages solve this problem by filtering out short-term fluctuations and highlighting the overall trend.
Traders use moving averages to:
- Identify market trends
- Confirm trend direction
- Find support and resistance zones
- Generate buy and sell signals
- Spot trend reversals
- Improve entry and exit timing
This is why moving averages are considered one of the most important indicators in technical analysis.
Types of Moving Averages
Although there are several variations, two types dominate market analysis:
Simple Moving Average (SMA)
Exponential Moving Average (EMA)
Understanding the difference between them is crucial.
What is a Simple Moving Average (SMA)?
The Simple Moving Average, or SMA, calculates the average closing price over a fixed number of periods.
For example:
A 10-day SMA adds the closing prices of the last 10 trading sessions and divides the total by 10.
Each price carries equal weight in the calculation.
Because all prices are treated equally, SMA reacts more slowly to sudden market movements.
This slower response often makes SMA useful for identifying long-term trends.
What is an Exponential Moving Average (EMA)?
The Exponential Moving Average, or EMA, gives greater importance to recent price movements.
As a result, EMA responds faster to market changes compared to SMA.
This faster reaction makes EMA particularly popular among:
- Intraday traders
- Swing traders
- Momentum traders
Because EMA adapts more quickly to changing market conditions, many traders prefer it when making short-term trading decisions.
SMA vs EMA: Which is Better?
One of the most common questions beginners ask is whether SMA or EMA is superior.
The answer depends on trading style.
| SMA | EMA |
|---|---|
| Slower response | Faster response |
| Better for long-term trends | Better for short-term trades |
| Less sensitive to price fluctuations | More sensitive to recent price changes |
| Popular among investors | Popular among traders |
Neither indicator is inherently better.
Many successful traders use both depending on their strategy and timeframe.
Popular Moving Averages Used by Traders
Certain moving averages are widely followed across global markets.
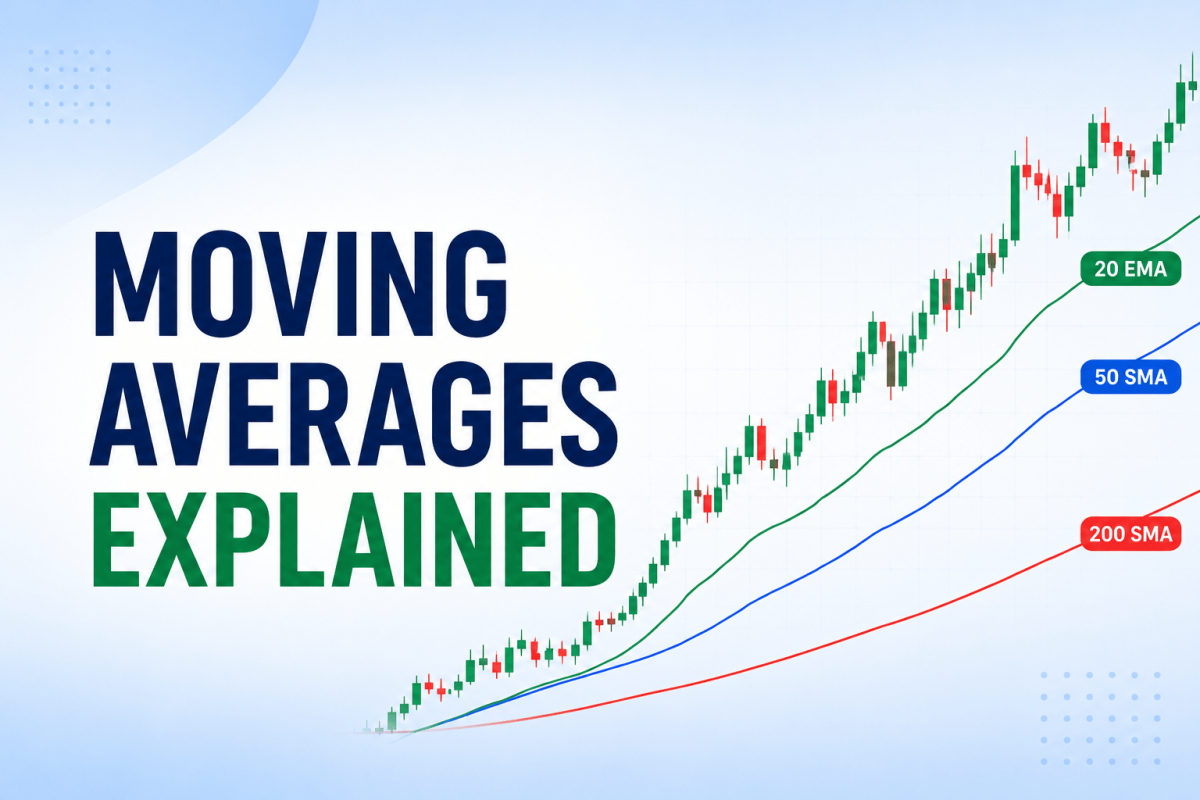
20 EMA
Often used by intraday and swing traders.
Helps identify short-term momentum.
50 DMA
One of the most watched medium-term trend indicators.
Many institutional investors monitor the 50-day moving average.
100 DMA
Useful for identifying medium-term market direction.
Often acts as dynamic support and resistance.
200 DMA
Perhaps the most important moving average in the market.
Investors use the 200-day moving average to determine whether a stock is in a long-term uptrend or downtrend.
A stock trading above the 200 DMA is generally considered structurally strong.
How Moving Averages Identify Trends
Moving averages make trend identification much easier.
Uptrend
When price consistently remains above a moving average and the average is sloping upward, the market is generally considered bullish.
This indicates buyers remain in control.
Downtrend
When price trades below a moving average and the average slopes downward, bearish conditions dominate.
This suggests sellers have greater control.
Sideways Market
When moving averages flatten and price moves around them frequently, the market lacks a clear trend.
During such periods, trend-following strategies often become less effective.
Moving Averages as Dynamic Support and Resistance
One fascinating aspect of moving averages is their ability to act as dynamic support and resistance.
Unlike traditional horizontal levels, moving averages continuously adjust with market prices.
For example:
A stock in a strong uptrend may repeatedly bounce from the 20 EMA or 50 DMA before resuming its advance.
Similarly, during downtrends, moving averages often act as resistance zones where selling pressure emerges.
Many traders combine moving averages with support and resistance analysis for stronger trade setups.
Moving Average Crossovers
One of the most popular moving average strategies involves crossovers.
A crossover occurs when one moving average moves above or below another.
These events often signal potential trend changes.
What is a Golden Cross?
A Golden Cross occurs when:
- Short-term moving average crosses above
- Long-term moving average
Most commonly:
50 DMA crosses above 200 DMA.
This signal is widely viewed as bullish and often indicates the beginning of a long-term uptrend.
Many investors use the Golden Cross as a confirmation of improving market strength.
What is a Death Cross?
The opposite of a Golden Cross is a Death Cross.
It occurs when:
50 DMA falls below 200 DMA.
This is generally interpreted as a bearish signal and may indicate weakening market conditions.
Although not always accurate, Death Cross formations often attract significant market attention.
Using Moving Averages with Candlestick Patterns
Moving averages become more effective when combined with candlestick patterns.
For example:
A Hammer candle forming near the 50 DMA can indicate potential buying interest.
Similarly, a Bearish Engulfing pattern near a falling moving average may strengthen bearish expectations.
Combining indicators with price action often improves decision-making.
Using Moving Averages with RSI
Many traders use moving averages alongside the RSI Indicator.
Imagine a stock pulling back toward the 20 EMA while RSI approaches oversold territory.
This combination can indicate:
- Healthy correction
- Potential trend continuation
- Improved reward-to-risk opportunity
Using multiple indicators helps reduce false signals.
Using Moving Averages with MACD
Moving averages and the MACD Indicator complement each other well.
While moving averages identify trend direction, MACD helps measure momentum.
For example:
- Price above moving averages
- Bullish MACD crossover
Together these signals may strengthen confidence in a bullish setup.
Best Moving Average Strategies for Beginners
Trend Following Strategy
Trade in the direction of the moving average trend.
If price remains above the moving average, focus on buying opportunities.
If price remains below it, avoid aggressive bullish trades.
Pullback Strategy
Wait for price to retrace toward the moving average during an established trend.
This helps traders avoid chasing extended moves.
Crossover Strategy
Use moving average crossovers to identify potential trend reversals.
Popular combinations include:
- 20 EMA and 50 EMA
- 50 DMA and 200 DMA
Common Mistakes Beginners Make
Using Too Many Moving Averages
Charts become cluttered and confusing.
Focus on a few relevant averages.
Ignoring Market Structure
Moving averages should complement price action rather than replace it.
Trading Every Crossover
Not every crossover leads to a strong trend.
Confirmation remains essential.
Ignoring Risk Management
Even the best setups can fail.
Always use stop-losses and proper position sizing.
Advantages of Moving Averages
Moving averages remain popular because they are:
- Easy to understand
- Suitable for beginners
- Effective across different markets
- Useful for trend identification
- Valuable for timing entries and exits
- Adaptable to various trading styles
Limitations of Moving Averages
Despite their usefulness, moving averages have limitations.
They are:
- Lagging indicators
- Less effective in sideways markets
- Vulnerable to false signals
- Based on historical data
Understanding these limitations helps traders use them more effectively.
Final Thoughts
Moving averages are among the most powerful and beginner-friendly tools in technical analysis. They simplify price action, help identify trends, and provide valuable insights into market behaviour.
Whether you use a Simple Moving Average (SMA) for long-term investing or an Exponential Moving Average (EMA) for active trading, moving averages can improve market analysis and decision-making.
However, like all indicators, they should not be used in isolation. Combining moving averages with support and resistance, candlestick patterns, the RSI indicator, and the MACD indicator can help traders build more reliable trading strategies.
For anyone learning technical analysis, mastering moving averages is an essential step toward understanding market trends and trading with greater confidence.
Frequently Asked Questions
What is a moving average in technical analysis?
A moving average is a technical indicator that calculates the average price of a stock over a specified period to help identify market trends.
Which is better, SMA or EMA?
SMA is often preferred for long-term trend analysis, while EMA reacts faster and is popular among short-term traders.
What is the most important moving average?
The 200 DMA is widely regarded as one of the most important long-term trend indicators.
What is a Golden Cross?
A Golden Cross occurs when a short-term moving average crosses above a long-term moving average, signalling potential bullish momentum.
Can beginners use moving averages?
Yes. Moving averages are among the easiest technical indicators for beginners to understand and apply.


 Easy & quick
Leave A Comment?