
The Nifty 50 continues to scale new lifetime highs, reinforcing surface optimism. However, a closer look at market breadth tells a very different story, one marked by divergence, narrow leadership, and weakening participation across several sectors.
While headline indices remain strong, the market’s underlying strength appears uneven, with only a handful of sectors and stocks contributing meaningfully to the rally.
This contrast between index performance and market participation highlights a crucial point:
The market is rising, but not everyone is participating.
Market Breadth: What the Numbers Reveal
Market breadth measures how many stocks are trading above key moving averages (50-, 100-, and 200-SMA). Strong markets generally show broad participation. But current data shows mixed signals.
Sectoral Breadth Analysis (Across 50, 100 & 200 SMA)
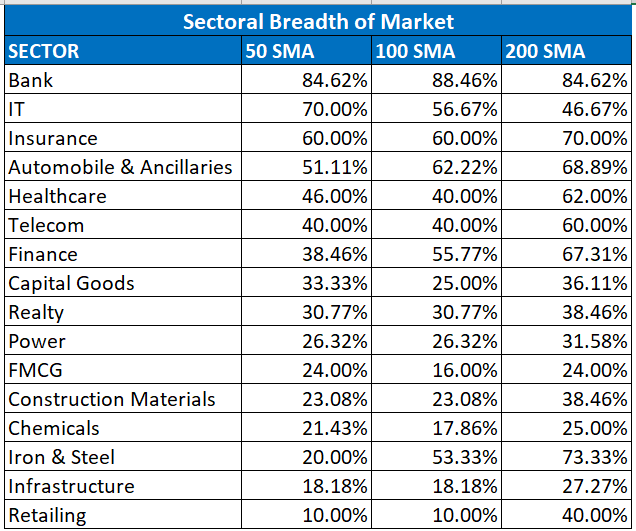
Here’s how different sectors are positioned:
Strongest Sectors (High Breadth Across All SMAs)
These sectors show strong participation, indicating healthy bullish sentiment:
- Banking:
- 50 SMA: 84.62%
- 100 SMA: 88.46%
- 200 SMA: 84.62%
One of the most stable and broad-based performers of the current rally.
- Insurance:
- 60% above 50 SMA
- 60% above 100 SMA
- 70% above 200 SMA
Consistent strength across timeframes.
- Automobile & Ancillaries:
- Improving breadth from 51% (50 SMA) to nearly 69% (200 SMA).
Indicating long-term buyers are active.
- Improving breadth from 51% (50 SMA) to nearly 69% (200 SMA).
- Iron & Steel:
- Strong recovery with 73.33% above 200 SMA
The sector is showing robust long-term positioning.
- Strong recovery with 73.33% above 200 SMA
Neutral to Moderately Strong Sectors
- IT:
- Strong on a short timeframe (70% above 50 SMA), but declines to 46.67% above 200 SMA.
Short-term strength but long-term weakness is still visible.
- Strong on a short timeframe (70% above 50 SMA), but declines to 46.67% above 200 SMA.
- Healthcare & Telecom:
- Mixed readings; both sectors improving near long-term averages.
- Finance, Capital Goods, Realty, Power:
- Show gradual improvement toward the 200 SMA, reflecting accumulation at lower levels.
Weak Sectors (Low Breadth Across SMAs)
These sectors reflect limited participation and underlying pressure:
- FMCG:
- Only 24% above the 50 SMA and 200 SMA
Shows signs of underperformance.
- Only 24% above the 50 SMA and 200 SMA
- Infrastructure:
- 18% above 50/100 SMA
- 27% above 200 SMA
Weakest breadth among cyclicals.
- Retailing:
- Just 10% above 50 & 100 SMA
- 40% above 200 SMA
Suggesting minimal buying interest.
Nifty 50 vs Broader Market: Major Divergence
Despite Nifty touching all-time highs, broader indices show weakening strength.
Market Breadth Summary
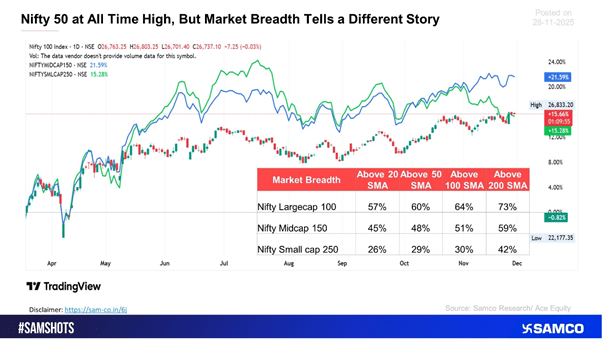
The percentage of stocks above major SMAs:
|
Index |
Above 20 SMA |
Above 50 SMA |
Above 100 SMA |
Above 200 SMA |
|
Nifty Largecap 100 |
57% |
60% |
64% |
73% |
|
Nifty Midcap 150 |
45% |
48% |
51% |
59% |
|
Nifty Smallcap 250 |
26% |
29% |
30% |
42% |
Key Insight:
Large-caps are driving the market higher, while midcaps and smallcaps lag significantly, especially on shorter timeframes. Only 26% of smallcaps are above their 20-day average, indicating subdued short-term sentiment.
Why This Divergence Matters
Even though Nifty is rallying, market breadth suggests:
1 Narrow Leadership
Only select sectors, Banking, Insurance, and Autos, are lifting the index.
2 Lack of Broad-Based Strength
Many sectors show weak or inconsistent participation.
3 Increased Vulnerability
When fewer stocks support the rally, markets become more sensitive to corrections.
4 Early Warning for Reversals
Declining breadth often precedes index consolidation or short-term pullbacks.
What Traders Should Watch Going Forward
Bank Nifty & Insurance Index Performance
They remain the strongest pillars of the current rally.
Improvement in Midcap & Smallcap Breadth
A rise above 50% in these segments would signal healthier market strength.
Sectoral Turnaround
Especially in FMCG, Retailing, and Infrastructure.
Broader Participation Above 50 & 100 SMA
This would confirm the sustainability of the uptrend.
Conclusion
While the Nifty 50 continues to hit fresh all-time highs, the underlying market breadth paints a more cautious picture.
The surge is being driven primarily by a few heavyweight sectors, predominantly Banking and Insurance, while a large part of the market remains subdued.
Until breadth improves across midcaps, smallcaps, and lagging sectors, the market may continue to show narrow, selective strength rather than a broad-based rally.