

In this article on what is Technical Analysis:
- What is Technical Analysis?
- The Three Tenets of Technical Analysis
- Myths of Technical Analysis
- Advantages of Technical Analysis
- Technical Analysis Vs Fundamental Analysis
- Basic Terms of Technical Analysis
- What Technical Indicators Mean and How to Use Them?
- 5 Ways to Make Money Using Technical Analysis
- Video on What is Technical Analysis
- Video on Three Tenets of Technical Analysis
Introduction to Technical Analysis
The term technical analysis is the most talked about term in the stock market. It is also the most misunderstood term in the market. When asked what is technical analysis, a majority of traders will say it is a sure shot way of predicting a stock’s price. Others would define technical analysis as a method of making quick profits. Can you imagine if these definitions of technical analysis were true?! Everyone would abandon fundamental analysis and we would all be rich quick. In reality, technical analysis is not a magic ball that can predict stock prices. It is also not a get-rich-quick scheme. So, what is technical analysis?
What is Technical Analysis?
Technical Analysis is a graphical and statistical study of historical data, mainly price and volume. It does not care why a stock is moving up or down. It also does not involve studying the balance sheet or quarterly reports of a company. Technical analysis skips the why and aims to understand the how…How is the stock price moving? Is the movement in stock price revealing an uptrend or a downtrend? Technical analysis is a study of price action. Technical analysts believe that price and volume are the only two driving forces in the market. So, if you can decipher price action, then you can make money in the market. So, what is technical analysis? Technical Analysis is a strategy in which you anticipate stock prices by interpreting past data. This is of course hoping that history will repeat itself.
Watch this video to learn what is Technical Analysis
History and Evolution of Technical Analysis
- A lot of us believe that technical analysis was introduced by Charles Dow. But this is not entirely true. The history of technical analysis goes back to the Babylonian period. During this time, the Assyrian trading stations in Turkey would track fluctuations in price of commodities.
- The next phase in the evolution of technical analysis took place in the 17th century. Joseph De La Vega was a diamond merchant who studied price fluctuations in diamonds. His book Confusion of Confusions is a bible for modern day technical analysts.
- Then came Candlestick patterns by Homma Munehisa. He used candlestick patterns to make profits in the rice futures market. Check out our detailed article on 8 basic candlestick patterns here.
- Finally came Charles Dow in 1896. He recorded the highs and lows of his trades and studied the patterns of market peaks and troughs (lows). Check out our video on the basics of Dow Theory.
- It was in 1929 that William Hamilton built upon the letters of Charles Dow and refined the Dow Theory. He also developed Railroad averages and Industrial averages which are used to identify bull and bear markets.
- George Lane developed the Stochastic Oscillator in the 1950s. It is a momentum indicator. It compares a security’s closing price to its price range over a specific time period. Don’t forget to check our detailed take on the Stochastic Indicator.
- In 1960s, Gerald Appel created the Moving Average Convergence Divergence or MACD. This powerful technical indicator shows the strength of a trend. It studies the difference between fast and slow exponential moving averages of closing stock prices.
- J Welles Wilder Jr developed the Relative Strength Index (RSI) in 1978. RSI indicator outlines the strength of a particular share or index. If RSI is above 70, then the stock is considered to be in the overbought zone. When RSI is below 30, then the stock is in the oversold zone.
Watch this video explaining the RSI indicator in Hindi.
- The next major development in technical analysis came in the 1980s. John Bollinger developed the Bollinger Bands. It is used to determine whether the stock is in the overbought or oversold zone.
- When the current market price of a stock is close to its lower Bollinger band, it signifies an oversold market.
- When the current stock price of a stock is close to its upper Bollinger band, it signifies an overbought market.
- Finally, the latest addition in the field of technical analysis is Algorithmic Trading. As the name suggests, it uses a defined set of instructions or algorithm to place a trade. It has the potential to generate trade and profits at an inhuman speed.
Want to know how to become an Algo Trader? Watch our video with Vivek Gadodia, a popular algo trader.
Let us now discuss the three tenets of technical analysis.The 3 Tenets of Technical Analysis
A solid foundation is must when you are building a big structure. This is also true for technical analysis. The entire world of technical analysis rests on three tenets or fundamental truths – 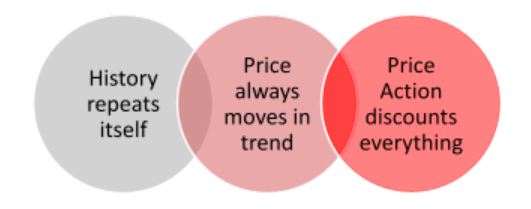 Let’s understand each one of them… History repeats itself: This is the first tenet of technical analysis. It says that investors will behave in the same way every time an event happens. For example, when the markets are in an uptrend, investors will get greedy and buy even if the price is high. Similarly, when the markets are in a downtrend, investors will sell at any price available even if they are holding fundamentally strong stocks. This is a predictable human reaction. So, when the behaviour repeats itself, price history will also repeat itself. The second tenet of technical analysis is that price action discounts everything. This is similar to the Efficient Market Hypothesis (EMH). So, a share’s current market price reflects all known and unknown information available. Any new information is quickly factored in to the prices. So, the prices will move based on demand and supply forces. And the final tenet of fundamental analysis is that price always moves in trend. If a stock is consistently moving up, then unless there is a consolidation or reversal, the stock will continue to stay in an uptrend. This is similar to Newtons law of motion, ‘an object in motion remains in motion unless acted upon by an unbalanced force’. So, unless there is a correction, the stock will remain in trend. This is why trend identification is crucial in technical analysis.
Watch our video on the basics of technical analysis for beginners in Hindi
Apart from these three tenets, technical analysis is combination of the following subjects–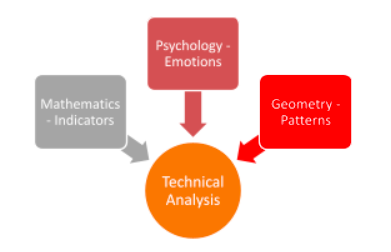
- Technical analysis is a study of mathematics. Investors have to be on their toes when it comes to identifying indicators like Bollinger bands, MACD etc.
- Technical analysis is a study of geometry. So, a lot depends on investors successfully identifying chart patterns to make money. Chart patterns like head and shoulders, ascending, descending triangles are very popular among traders. Watch this video and learn how to read technical charts in Hindi.
- And finally, technical analysis is a study of psychology. Even if we don’t accept it, our buying and selling decisions are influenced by our emotions. This is why we sell fundamentally strong stocks simply because the overall market is falling.
Now that we have covered the basics of technical analysis, let us quickly take a look at the most common myths that investors have about technical analysis.
Myths of Technical Analysis
- The biggest myth of technical analysis is that it is suitable for day trading only. This is obviously wrong. Investors can also use technical analysis for swing trading or positional trading. Technical analysis is also popular among hedge fund managers and institutional investors.
- The next myth about technical analysis is that it can be used to accurately predict stock prices. Remember, technical analysis can only tell you about market trends. It cannot accurately predict stock prices. Technical analysis is a game of probability not certainty.
- Another myth of technical analysis is that you cannot get rich using technical analysis. It is assumed that only fundamental analysis can help you create long-term wealth. However, there are many billionaires who have created long-term wealth using technical analysis. These include Ray Dalio, George Soros etc.
Watch this video to learn the detailed myths of technical analysis
Let us now look at the key advantages of Technical Analysis.Advantages of Technical Analysis
- Ease of Decision Making: The biggest advantage of technical analysis is that it makes decision making easier. This is because it takes only price action into consideration. In case of fundamental analysis, you have to study a company’s balance sheet, business cycles, profit and loss, management decisions etc. But in technical analysis, the prime focus is price action. This is how technical analysis makes decision making easier.
- Saves Time: Technical analysis is less time consuming compared to fundamental analysis. In fundamental analysis, you have to spend hours and days studying a company’s balance sheet, income statements etc. But in technical analysis, price action is everything. This helps investors take quicker investment decisions and take advantage of the trend before it reverses.
- Easy Back-Testing: Remember that in technical analysis, history repeats itself. So, you can easily back-test your strategies to see the results, identify and correct flaws.
- Softwares are Easily Available: There are numerous low-cost or free technical analysis softwares available online. These tools have made technical analysis super easy for novice traders. These charting softwares can help you generate buy and sell signals easily.
- Technical Analysis Helps in Creating Investment Discipline: A key rule of technical analysis is that you must respect your stop-loss. This helps in creating investment discipline as new traders learn to size their positions and learn to book their losses using strict stop-loss.
- Technical Analysis Helps in Timing the Market: Fundamental analysis helps you discover stocks trading below their intrinsic value. But it does not tell you the best time to buy these stocks. This is where technical analysis helps. With technical analysis, you can determine when a stock is trading below its 20-day moving averages. You can also determine if a stock is in the overbought or oversold zone using the RSI indicator etc.
Before we discuss the 10 basic terms of technical analysis, let us look at the difference between technical analysis and fundamental analysis.
Difference between Technical Analysis & Fundamental Analysis
- Core Objective: The main purpose of fundamental analysis is to find a company’s intrinsic value. It involves studying a company’s balance sheet, income statements etc. The aim is to invest in stocks trading below their intrinsic value and make money when markets realise the true worth of these stocks.
Technical analysis does not study a company’s balance sheet or income statements. This is because technical analysts believe that price action discounts all information about a stock. The only factors that will affect a company’s share price is demand and supply. Price and volume helps to identify where a stock is headed.
- Time Horizon: Fundamental analysis is a long-term approach to investing. Whereas technical analysis is more apt for short-term time horizon. The reason behind this is the availability of the underlying data. For example, in fundamental analysis, analysts study balance sheet, quarterly results, earnings per share etc. This data does not change overnight. Whereas technical analysis is more short-term because data such as open, high, low, price, volume etc. is dynamic and changes within minutes. However, technical analysis can also be used for long term analysis. Check out our video on 8-year cycles in Sensex.
- Goals: The goal of fundamental analysis is starkly different from technical analysis. For example, a technical trader is more concerned about short-term and ultra-short-term movement in stock prices. Whereas a fundamental investor is more interested in what moves a stock in the long-term. They are most concerned with financial ratios while technical analysis focuses on charts and patterns.
- Efficient Market Hypothesis (EMH): The biggest difference between technical and fundamental analysis is the opposing view on EMH. Fundamental analysis believes that markets are not efficient. They believe that stocks are trading in the market at below their intrinsic value. So, it aims to find such below intrinsic value stocks and wait for them to appreciate.
Technical analysis on the other hand believes that market is efficient. So, every information (public or private) is factored in a stock’s market price. So, the stock price will not react to market noise. Instead it will react only to demand and supply factors. Till now we have covered what is technical analysis, its three tenets, myths and advantages. Let us now look at the 10 most important terms relating to technical analysis.
Basic Terms Relating to Technical Analysis
1. Resistance: Demand and supply factors majorly influence stock prices. If the demand for a stock is more than its supply, then the stock price will go up and vice-a-versa. Resistance level is a price point where the number of sellers is more than buyers. It is the price where the stock is facing strong selling pressure. This is usually the level at which lot of investors sell the stock. 2. Support: This is the lower level at which the stock has more buyers than sellers. The support level is point where the number of buyers are more than sellers. It is price where demand for a stock is more than supply. When a stock is near its support level, an upward price move can be expected. [Watch our video on support and resistance] 3. Volumes: This is an important term in technical analysis as it helps us confirm trends. Volumes is the total number of shares bought and sold over a period of time. The below table shows the relationship between price and volume.
| Price of the Stock | Volume | Interpretation |
| Increases | Increases | The stock is in a healthy uptrend. |
| Increases | Decreases | The stock is in weak uptrend. |
| Decreases | Increases | The stock is bearish. This generally confirms momentum. |
| Decreases | Decreases | This is a negative signal. |
Watch this video to learn Price Volume Analysis from Nooresh Merani
4. Moving Averages: This technical indicator can be used to identify buying and selling opportunities in the market. When a stock trades above its moving average, it means the stock is in a strong uptrend. This signals that traders are going to buy this stock and it is good idea to go long. When a stock trades below its average price, it signals a downtrend. This is typically a sell signal for traders. 5. Candlestick Charts: This is a form of chart which represents four basic yet important data of a stock – Open High Low Close (OHLC). A bullish candle is formed when closing price of a stock is more than its open price. A bearish candle is formed when opening price is more than the closing price. Learn about the 8 basic candlestick patterns here. 6. Relative Strength Index: This is a momentum indicator and helps in identifying trend reversals. When the RSI value of a stock is between 0-30, it means that the stock is oversold. This is a possible buying opportunity for traders. An RSI value between 70 and 100 signify stock is in overbought zone and usually a selling opportunity. Learn about the RSI in detail with our video. 7. Dow Theory: This theory was developed by Charles Dow and polished by William Hamilton. As per Dow theory, markets are divided into four repetitive phases –| Phase | Interpretation |
| Accumulation | The stock is in sideways phase with flat tops and flat bottoms. This is a buying opportunity for value investors. |
| Mark-up | After accumulation, the stock goes in an uptrend with higher tops and higher bottoms. This phase has high volumes and ideal for momentum traders. |
| Distribution | This is a profit-booking phase for value investors who had invested during the accumulation phase. |
| Mark-down | In the mark-down phase, the stock is reversing after an uptrend. This phase is signified by lower tops and lower bottoms. |
[Must Watch: Four Phases in Market Cycles]
What Technical Analysis indicators mean and how to use them?
Technical Analysis indicators are mathematical calculations based on price and time as principal inputs. These technical indicators suggest likely market tops and bottoms in the medium to short term. There are many successful traders who do not use any indicators. They believe that they are just the derivatives of the price and focusing on them dilutes the main focus which is price. However, some others have still carved out successful trading strategies based on indicators like MACD, ROC, RSI, Stochastic etc. What suits a particular trader may not be suitable for others. Each one has to find his or her own indicator that works well. As a rule, no indicator is good or bad. The real secret is to stick to an indicator or strategy and allow it an adequate time.
5 biggest secrets for making money using technical analysis:
- Go with the major trend
- Do not pre-empt trend reversals
- Stay away from sideways or correcting markets
- Scan many securities to identify right tradable setups
- Trade only in highly liquid stocks and securities
This concludes our article on what is technical analysis. You can check our detailed playlist on technical analysis here. There is no doubt that technical analysis is a great way to create wealth in the market. But what is paramount is that you learn and implement technical analysis with the experts. Samco is India’s leading discount broker and helps intraday and positional traders by providing free charts both Intraday and end of day charts along with major technical analysis indicators. Open a FREE Demat account with Samco Securities and enjoy share trading with the best broker in India today!


 Easy & quick
Leave A Comment?