

Moving Averages is one of the oldest trend indicators used in technical analysis. Do you know what is the easiest way to make money in the stock market? You simply have to identify a trend at the correct time and then ride the rally. But how can a common investor identify a trend? The mere sight of a technical chart is enough to give you a headache. But this is where moving averages come to the rescue. You must have heard news anchors saying a stock is in a bullish trend as it is above its 200-day moving average. But exactly, what are moving averages? What do moving averages imply? Which moving averages should you consider? – 5-Days, 20-Days, 50-Days or 200-Days? And most importantly, how do you use moving averages to identify trends in the stock market? These are some of the questions that we will answer in this article.
In this article on Moving Averages
- Understanding Averages
- What are Moving Averages?
- How to Use Moving Averages in the Stock Market?
- Most Common Combinations of Moving Averages
- Disadvantages of Moving Averages
- Moving Averages Compression
Understanding Averages
Now before we understand what are moving averages, let us first understand what are averages. Imagine the Indian cricket team is playing a T-20 international match. The top five batsmen have scored the following runs–
| Batsman | Runs |
| Rohit Sharma | 51 |
| KL Rahul | 0 |
| Virat Kohli | 24 |
| Mayank Agarwal | 15 |
| Ajinkya Rahane | 35 |
The total runs scored by all five batsmen is 135. The average runs scored by these five batsmen is 27 runs (135/5). But does this mean that every batsman scored 27 runs? No, because KL Rahul got out on a duck. While Rohit Sharma scored almost double of the average. So, averages tell you the midpoint of the group. The table below shows the closing price of HDFC Bank Ltd. over a 5-day period. Let us calculate the average closing price of the stock.
| Date | Price |
| Dec 20, 2021 | 1425.65 |
| Dec 21, 2021 | 1441.80 |
| Dec 22, 2021 | 1445.20 |
| Dec 23, 2021 | 1444.10 |
| Dec 24, 2021 | 1438.90 |
The 5-day average closing price of HDFC Bank Ltd is Rs 1,439.13. Notice that on some days the stock is trading above this average. While on the other days, it is trading below its 5-day average. Let us now understand what are moving averages. A moving average calculates the average price of a stock over a specific period of time. You can calculate moving averages for any time frame – 5 minutes, 5-days, 50-days, 200-days etc. The shorter your holding period the shorter your moving average. The longer your holding period the longer your moving average. Long-term investors prefer the 200-day moving average. This is because the 200-day period covers almost 10 months' prices. This gives the traders sufficient price information to form a view. The table below shows the closing price of HDFC Bank Ltd. Let us calculate the 10-day moving average of HDFC Bank Ltd.
| Date | Price | Moving Averages |
| Dec 01, 2021 | 1504.65 | |
| Dec 02, 2021 | 1525.75 | |
| Dec 03, 2021 | 1513.55 | |
| Dec 06, 2021 | 1503.80 | |
| Dec 07, 2021 | 1525.70 | |
| Dec 08, 2021 | 1553.80 | |
| Dec 09, 2021 | 1526.85 | |
| Dec 10, 2021 | 1522.55 | |
| Dec 13, 2021 | 1511.15 | |
| Dec 14, 2021 | 1502.45 | |
| Dec 15, 2021 | 1500.00 | 1519.03 |
| Dec 16, 2021 | 1500.10 | 1518.56 |
| Dec 17, 2021 | 1473.05 | 1516.00 |
| Dec 20, 2021 | 1425.65 | 1511.95 |
| Dec 21, 2021 | 1441.80 | 1504.13 |
| Dec 22, 2021 | 1445.20 | 1495.74 |
| Dec 23, 2021 | 1444.10 | 1484.88 |
| Dec 24, 2021 | 1438.90 | 1476.61 |
To calculate the moving average of 15th December 2021 –
- You must add HDFC Bank’s share price for last 10 days (1st – 14th December)
- Now divide the total by 10.
To calculate the moving averages for the next day, 16th December 2021 –
- You will exclude the share price on 1st December 2021
- And you will include the latest share price of 15th December 2021.
Notice that you are moving away from the old share price and towards the latest one. Hence, the name moving averages. Let us now take a look at the exact definition of moving averages –
What are Moving Averages?
Moving average is the average price of a stock at a specific point in time. It tries to discover a trend in the share prices. Moving averages give unique signals that are used in combination with other traditional chart patterns like Relative Strength Index etc. There are multiple types of moving averages. Here’s a list of the types of moving averages used in technical analysis –
- Simple Moving Average (SMA)
- Exponential Moving Average (EMA)
- Weighted Moving Average
- Time Series Moving Average
- Triangular Moving Average
- Variable Moving Average
- VIDYA Moving Average
- Welles Wilder Moving Average
In this article, we are going to focus on the two main types of moving averages –
- Simple Moving Average – SMA
- Exponential Moving Average – EMA
Simple Moving Averages (SMA) give equal weightage to all data points. So, as per simple moving average, there is no difference between the share price of HDFC Bank Ltd on 1st December and 15th December. Exponential Moving Averages (EMA) gives more weightage to the latest share price and the oldest data point gets the least weightage. Hence, EMA is more reactive to recent share prices than SMA. Think of SMA as a test match and EMA as a T-20 match. EMA is more live, and in the moment. This is why technical analysts and traders prefer EMA as it is more in sync with the latest share price. Moving averages can be calculated on alternative prices - closing price, open, high, or low. But in most cases the closing price for the day is considered to calculate moving averages. An important thing to note about moving averages, is its sensitivity to changes in stock prices.
Sensitivity of Moving Averages
The shorter the moving average is, the greater is its sensitivity to changes in the stock price. For example, a 5-day moving average is much more sensitive than a 20-day moving average. There isn’t just one right time frame to pick a moving average. It all depends on two things –
- Are you a short-term trader or positional trader?
- Is the market trending or non-trending?
If your holding period is long, then you must consider a longer moving average. If the market is non-trending then shorter moving averages are preferable.
How to Use Moving Averages in the Stock Market?
Moving averages help traders and investors in identifying buying and selling opportunities in the market. Here is how moving averages work –
- When a stock is trading above its moving average – This means that traders are ready to buy the stock at a higher price than its averages. This will only happen when traders are bullish on the stock. So, traders are expecting the stock prices to increase further and hence they are willing to pay more than the average price of the stock. So, if a stock is trading above its 200-DMA, it is a good buying opportunity.
- When a stock is trading below its moving average – This shows that the traders are willing to sell the share at a lower price than its average. When will a trader do this? Only when, he believes the share price will plummet further. Hence, he is willing to take a lower price than the stock’s average. This is a good selling or short-selling opportunity for traders.
Summary:
- Whenever a stock’s moving average is consistently rising, it means that the stock is in uptrend.
- If a stock’s moving average is declining steadily, the stock is in downtrend.
- Moving averages work brilliantly when a stock is in trend. But not so much when the stock is trading sideways.
Now investors and traders use different moving averages. An intraday trader may focus on a 5 minute-period moving average on a 30 minute or one-hour chart. Whereas a long-term investor will focus on 100-day EMA or a 200-day EMA. Traders can also look at combinations of moving averages to decide their position in the market.
Most Common Combinations of Moving Averages in Trading
- The 9-day and 18-day SMA is used to identify short-term trends. A strong buy signal is generated when the 9-day moving average crosses above the 18-day moving average.
- A combination of 13 and 30-day SMA is used as a secondary trend indicator.
- The 50-day and 100-day SMA is used to identify long-term trends in the market.
Now we have spoken enough about the advantages of moving averages. Let us quickly take a look at an important disadvantage of moving average.
Disadvantages of the Moving Averages
The biggest assumption when using moving averages is that markets are often in trend. But in reality, markets spend more time in consolidations. Also, quick-turning markets will always be well ahead of the moving averages. Thus, giving delayed signals for entry and exit by which time the best part of the move is probably over. In the example below, the moving average crossover system has captured big moves during trending phase whereas during the non-trending phase there were whipsaw losses in the Nifty50. 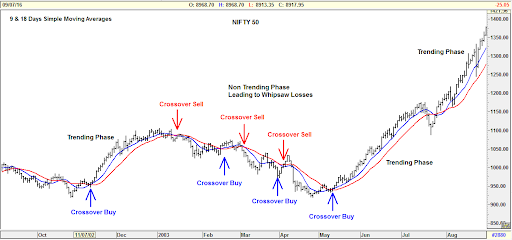 Now before we end our discussion on moving averages, let us study this one important concept – Moving Average Compression.
Moving Average Compression
Moving averages compression is when the 50-day, 100-day and 200-day moving averages converge or overlap. After this point, the stock can either be in strong uptrend or downtrend. Let us take the example of Tata Consultancy Services Ltd. 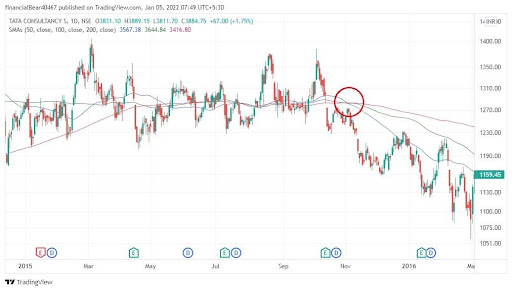 Notice what happens on November 3, 2015 - All three moving averages, 50-day, 100-day and 200-day converge. The share price of TCS was Rs 1,246.87. After this compression, the stock price fell down to Rs 1,141.44 by December 3, 2015. This is a fall of 8.45% in one-month. The below chart is of Reliance Industries Ltd. A moving averages compression was formed in the stock on April 15, 2014. Its share price was Rs 457.49. Post this compression, the stock went into a major uptrend. Its stock price reached Rs 520.27 on July 22, 2015. That's an increase of 13.72%. So, whenever you are using moving averages in stock trading, don’t forget about moving averages compression. Watch this video by Mr Umesh Mehta where he talks about Moving Averages Compression
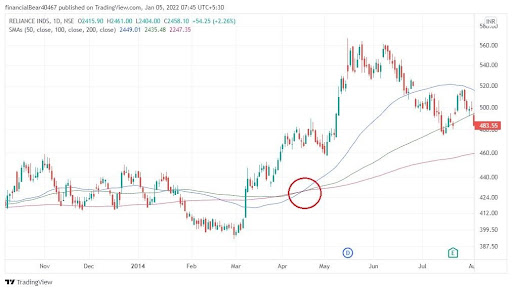
Moving Averages as Support and Resistance
You can also use moving averages as support and resistance during trading. Support is the price level below which a stock is not expected to fall. And resistance is the price level above which a stock is not expected to rise. Many times, a stock will trade in line with its 50-day EMA and then reverse. Take the example of the 200-Day Moving Average.
- Stocks in secular bull markets tend to hold above the 200 DMA.
- While stocks in a secular bear market usually trade below the 200 DMA for extended periods of time.
In the below chart, we have plotted the 200-DMA for Tata Consultancy Services Ltd. As you can see, the 200-DMA is a strong support level for the stock. Every time the 200-DMA has been broken the stock price has taken a hit. 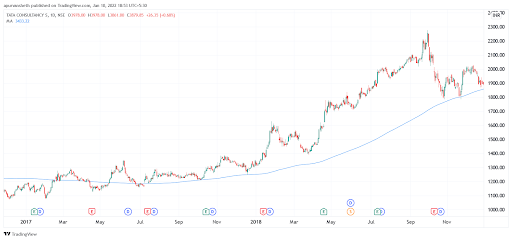 The more times a moving average is touched, the greater is the significance of a violation. A penetration of a moving average is a signal that a change in trend may be taking place. Signals generated from the moving averages are infallible. But sometimes due to whipsaws losses during the sideways market, traders abandon the moving average system due to lack of conviction. However, after every phase of sideways correction, the time for major moves does and always comes. This is the best time for generating profits. Unfortunately, most traders have already abandoned the system. Thus, traders and investors must have the iron rod discipline to follow the moving average system diligently for superior risk adjusted returns. Some of the most consistent hedge fund managers use moving averages to generate superior returns for decades. Moving Average is the founding pillar for effective and profitable technical analysis. Subscribe to Samco Securities YouTube Channel and learn everything about the stock markets. From technical analysis, to fundamental analysis and stock research. We’ve got you covered! You can also open a Demat account with Samco Securities and get technical and fundamental trading ideas at your fingertips.


 Easy & quick
Leave A Comment?