

In this article, we will cover
- What is a head and shoulders pattern?
- Components and psychology behind the formation of the head and shoulders pattern.
- How to trade using a head and shoulders pattern?
- Real-life examples of a head and shoulders pattern
So, let’s begin. The head and shoulders pattern is a popular price reversal pattern which helps you analyse if an ongoing uptrend is coming to an end. I know that whenever you think of head and shoulders, the first thing that comes to your mind is the popular dandruff shampoo. But the term head and shoulders is not only popular for dandruff reversals but also popular for trend reversals. It gives you an early exit signal. By using the head and shoulders pattern, you can make money by exiting a stock at the right time. You can also make money by placing a short selling stocks. But what is a head and shoulders pattern and how to place profitable trades using this pattern? This is exactly what we will explore in this article.
What is a Head and Shoulders Pattern?
The head and shoulders pattern is a bearish reversal pattern. Now you must be wondering, what is a bearish reversal? A bearish reversal is an indicator that helps you predict that the share price might start falling. It occurs in an uptrend. A head and shoulder reversal pattern forms and if you see a confirmation, it is then said that there is going to be a bearish reversal. Take a look at the illustration below. 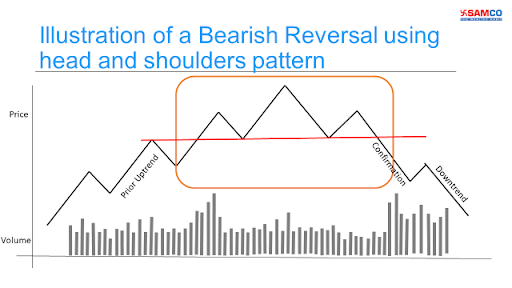 This is how a bearish reversal would look like. It starts with a previous uptrend, then a reversal pattern is formed (the highlighted section in red). After the pattern, you must get a confirmation followed by the downtrend. Now, the highlighted section in red is a head and shoulders pattern. It is called a head and shoulders pattern because just like a human body, the pattern also has a head, two shoulders and a neckline.
To understand the head and shoulders pattern in detail watch the video.
Let’s now zoom into the highlighted section and look at the components of a head and shoulders pattern.
The Components and Psychology Behind the Formation of Head and Shoulders Pattern
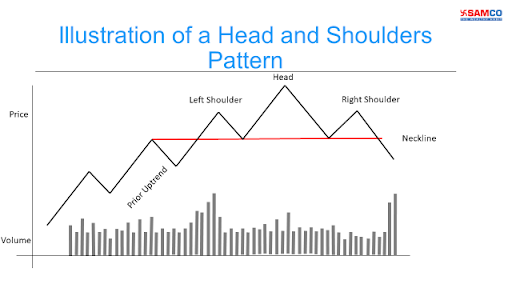 Traders often feel that three triangles formed anywhere on the chart refer to a head and shoulders pattern. But that’s not true. As the head and shoulders pattern is a bearish reversal pattern, it is formed after a previous uptrend. The left shoulder is formed when traders are optimistic about the markets and are expecting the upward momentum to continue. Because of high demand, the stock hits a new high. Here some traders book profits while others who expect the prices to fall enter into a short position because of which the pullback takes place. This completes the left shoulder.
 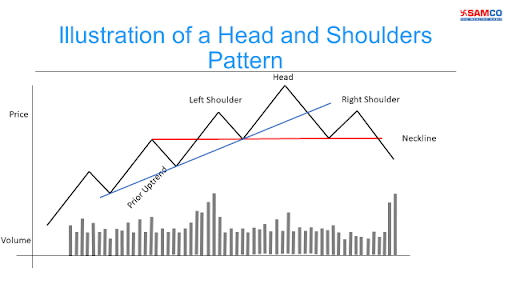 Now if you carefully see, we have plotted a blue support line in the above image. As soon as traders experience a pullback after the formation of the left peak and the price hits the support level (the blue line), traders find this as a good buying opportunity. The buying pressure will push the prices higher. On the other hand, traders who had placed short orders cover their position in losses. So, with minimum selling pressure, the stock price hits a higher high also known as the head of the pattern. The traders who had bought the share in the uptrend are happy and few of them might book profits at this stage. Now, during the formation of the head, the stock hits higher highs but with low volume. This indicates that the trend is not that strong and short traders enter into a position. This creates uncertainty. The traders who had a bullish view start to exit the trade in minimum profits or losses. With high selling pressure, the share prices drop down below the support level (blue line). This forms the head of the head and shoulders pattern. As the share price drops below the support level (the blue line), traders think that the share is in the oversold region and they find this as a good buying opportunity and they enter into the position. This pushes the stock price higher. But the price moves up only till the top of the left shoulder because of low buying interest. Again, there will be a selling pressure which will push the prices down. This forms the right shoulder. The red line in the image above is called the neckline. It is formed by drawing a line under the lows before and after the head. So, after the formation of the right shoulder and the price touches the neckline, it completes the head and shoulders pattern. Now that the head and shoulders pattern is complete, does this mean that you should enter into the position considering that the price will fall further? The answer is no. In any reversal price pattern, three things are mandatory.
- A prior trend
- The reversal pattern
- Confirmation of the reversal
But how do you get a confirmation that there has been a reversal after the head and shoulders pattern is formed? Take a look at the illustration plotted below. 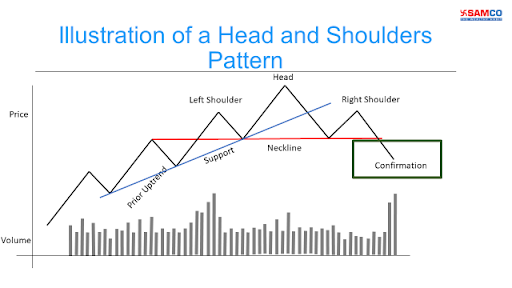 When the fall in price from the right shoulder intersects the neckline, it acts as a break-even point for those traders who had bought the share at the left shoulder. The break-even point is simply the point at which a trader is at no profit no loss position. And the traders who had bought the share in the head region are at a loss. As the share price dips after the formation of the right shoulder, the traders with a bullish view start to panic. This makes them cover their positions. With high selling pressure, the share price drops below the neckline with high volumes which confirms that there has been a reversal.
How to Trade Using Head and Shoulders Pattern?
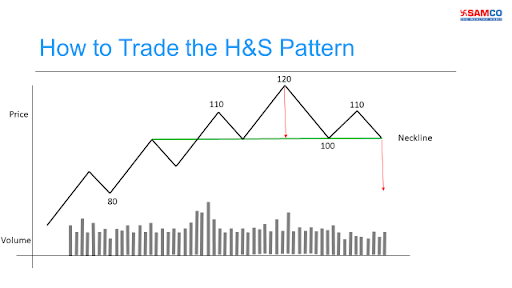 Take a look at the chart above where we have plotted the price of a share. Here, the stock is in an uptrend and has rallied from Rs. 80 to Rs 110. The right peak is formed at Rs. 110. The head is formed at Rs. 120 and again the left peak is formed at Rs. 110. The neckline drawn is at Rs. 100. We all know by now that you must enter into the position after the confirmation of a reversal. In this case, you must enter into the trade only when the price drops below the neckline of Rs. 100. But the question is when is the right time to exit the trade? Well, you simply have to follow these two rules.
- Measure the vertical price difference from the peak of the head to the neckline. In this case, the peak is Rs. 120 and the neckline is at Rs. 100. So, the difference is Rs. 20 (Rs. 120 - Rs. 100)
- From the neckline, deduct the difference amount. It will act as your target price. Here, the target price would be Rs. 80 (Rs. 100 - Rs. 80)
Real-life Examples of a Head and Shoulders Pattern
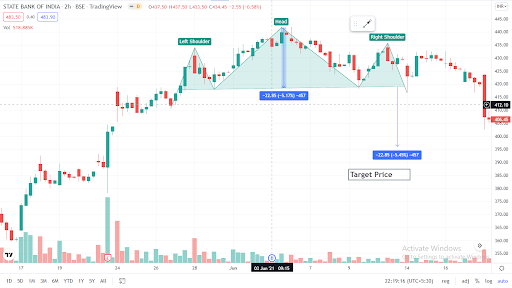
Head and Shoulders pattern formed in SBI
We can see the formation of a head and shoulders pattern in the chart of State Bank of India (SBI). The stock was in an uptrend and rallied from Rs. 378.15 to Rs. 418.15. After which we saw the formation of a head and shoulders pattern with the following details. Left shoulder = Rs. 434. 10 Head = Rs. 441.80 Right shoulder = Rs. 435.65 The vertical price difference between the neckline and the head was 22.85%. So, after confirmation, you could place a short trade with a target of Rs. 399. After a few days of the formation of the head and shoulders pattern, the stock hit a low of Rs. 402.95 which is close to our target price. 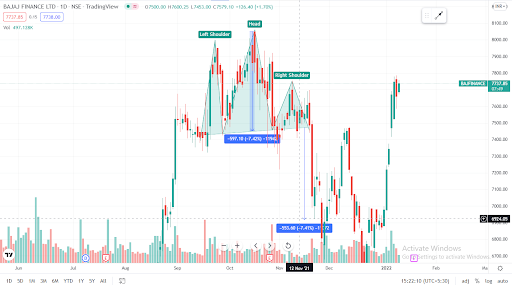
Head and Shoulders pattern formed in Bajaj Finance Ltd.
We had seen a long bullish rally in Bajaj Finance from 16th August 2021 to 31st August 2021 from Rs. 6,115.80 to Rs. 7,608.60. Later, the stock took a small dip and bounced back to form the head and shoulders pattern. Left shoulder = Rs. 7,988.05 Head = Rs. 8,037.80 Right shoulder = Rs. 7,745.45 The vertical price difference between the neckline and the head was 7.42%. So, after the stock broke the neckline you could enter into a trade with a target of Rs. 6,915.05. On 26th Nov 2021, the stock hit a low of Rs. 6,775.10. So, it surpassed our target price. 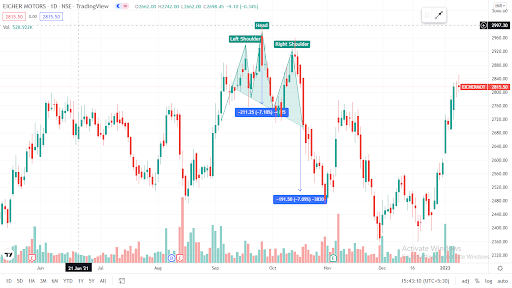
Head and Shoulders pattern formed in Eicher Motors
From 31st August 2021 to 8th September 2021, the stock price of Eicher motors was in an up move. It rallied from Rs. 2,547.65 to Rs. 2,878.80. After a small dip, the head and shoulders pattern was formed. Left shoulder = Rs. 2,925.80 Head = Rs. 2,979.70 Right shoulder = Rs. 2,923.10 The vertical price difference between the neckline and the head was 7.10%. So, after confirmation, you could enter into the trade with a target of Rs. 2,511.35. After a few days, the stock hit a low of Rs. 2,469.05 which was far below our target price.
Bottom line
These were some real-life examples of the head and shoulders pattern. I hope you found this guide helpful. Learning about chart patterns will strengthen your base and unlock new doors to creating wealth in the stock markets. The head and shoulders pattern is indeed a popular reversal pattern. All you need to do is understand the psychology behind the formation of the pattern and enter with the right strategy. By doing so you can truly mint money from the markets. This was one chapter of technical analysis. But there is so much more to learn. Our Chief Market’s Editor, Apurva Sheth has created a playlist on the basics of technical analysis. Check it out by clicking here! To start trading open a FREE Demat account with Samco and apply your trading skills to make money from the stock markets.
Happy trading


 Easy & quick
Leave A Comment?