

In this article, we will discuss
- What is TradingView?
- Samco’s Integration With TradingView
- What Are the Different Tools and Features of TradingView?
- Who Should Use TradingView?
- How Can Samco Help You?
Trading involves the use of several analytical tools, charts, etc., to make estimates on stock price movements. Doing so helps traders plan their entry and exit points, thus increasing the chances of profit from each trade. Now, to get this type of data, traders usually rely on several websites, platforms and mobile applications. Among them, one noteworthy name is TradingView. This article covers the benefits of using this charting platform, its tools, and much more.
What is TradingView?
TradingView is a financial market analysis platform. It offers a comprehensive range of tools for fundamental and technical analysis like indicators, customisable charts, alerts, etc. Users can find data related to several asset classes and markets, making it suitable for all types of traders. Moreover, TradingView provides global market data coverage. This enables traders to get real-time information on the securities they are tracking and make informed decisions. Apart from this, the website acts as a social network networking solution. Thus, traders from all over the world can connect, learn and share ideas with each other. Founded in 2011, TradingView was the brainchild of Constantin Ivanov, Denis Globa and Stan Bokov. Over time, it has become one of the most reliable data analysis and social platforms for the global financial community.
Samco’s Integration With TradingView
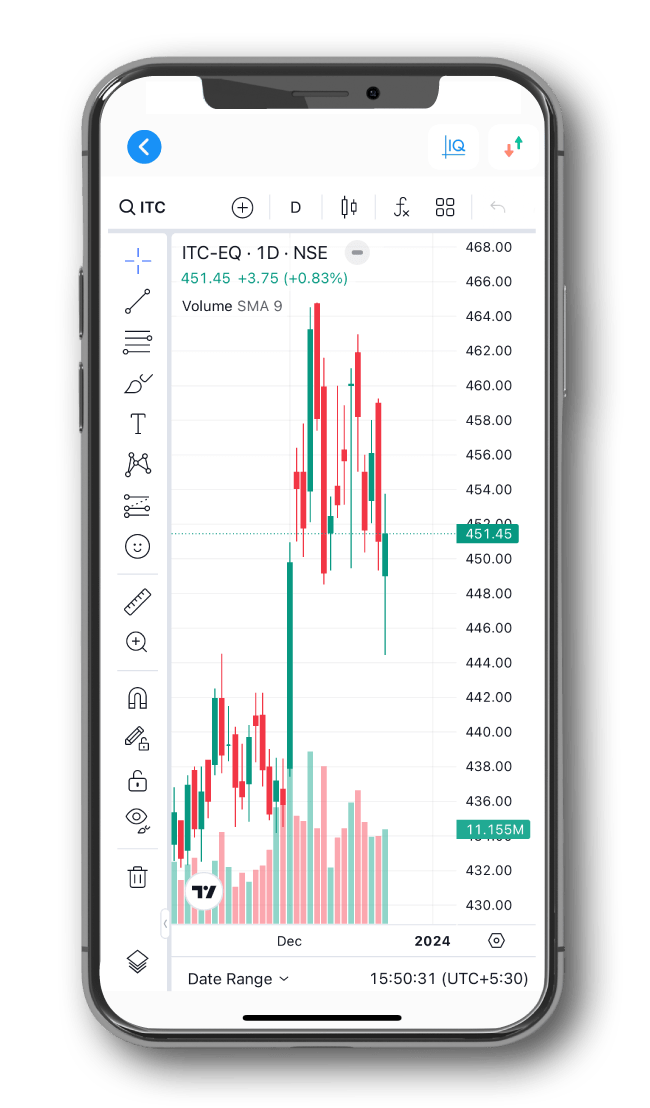
The good news for Indian traders is that they can enjoy all the benefits of the TradingView platform right from the Samco Mobile App. With just a few clicks, you can view TradingView charts and track the price movements of your target assets. Furthermore, you can assign numerous indicators both on TradingView and ChartIQ. Here are the steps to switch to TradingView charts on the Samco app:
- Step 1: Open the Samco trading app and log in using your credentials.
- Step 2: Navigate to the section pertaining to the stock you want to study and long-press on the stock’s name.
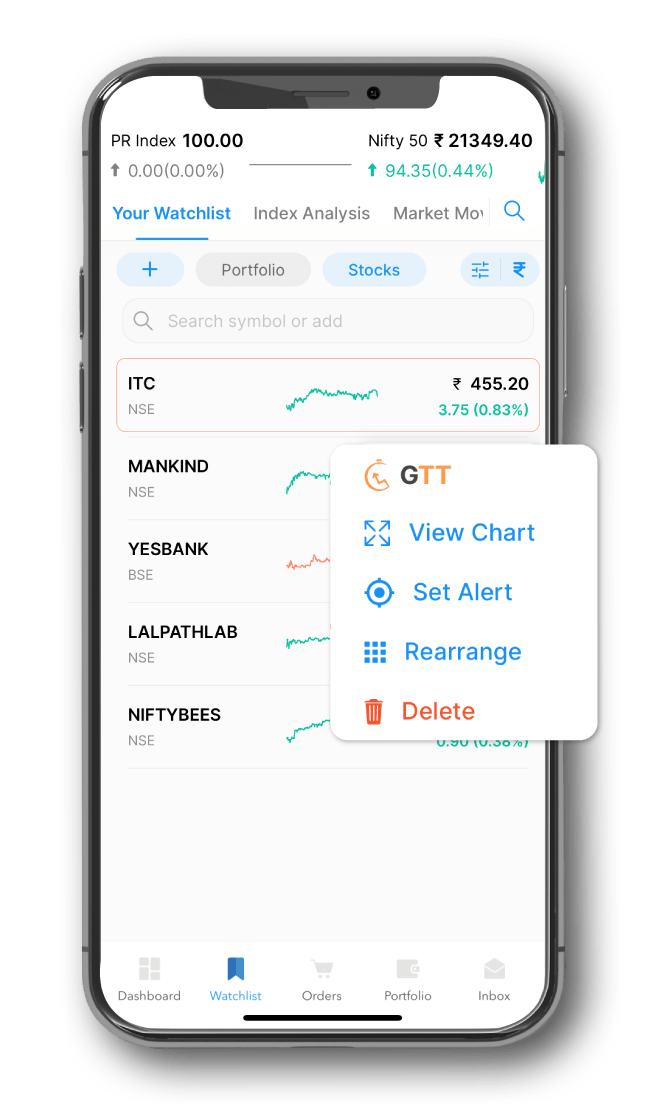
- Step 3: Click on the ‘View Chart’ option.
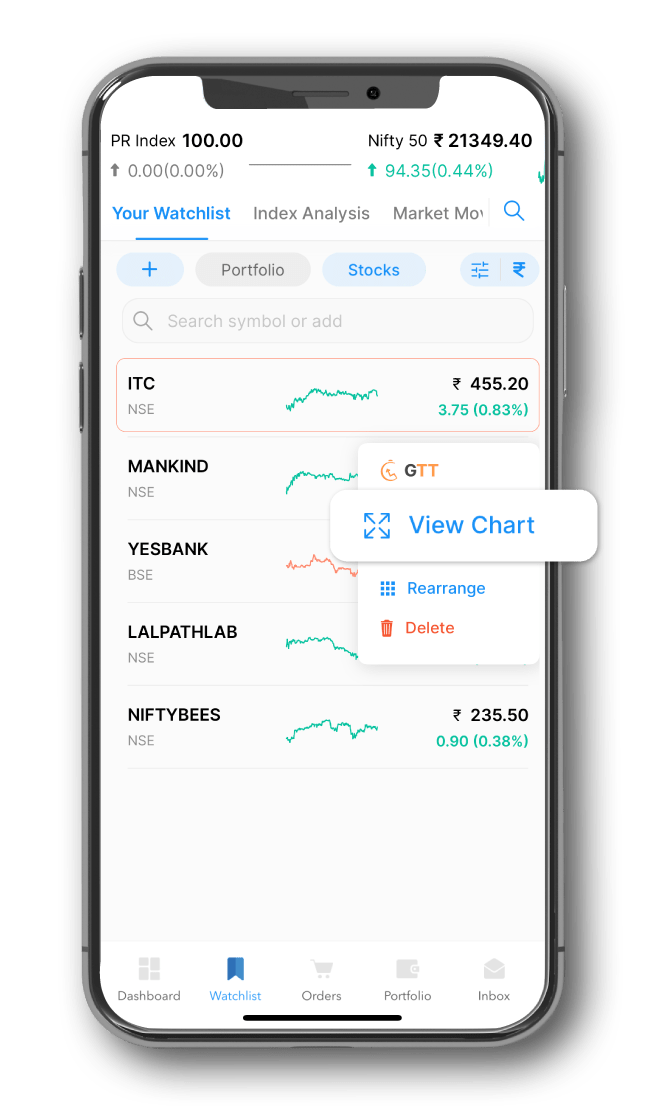
- Step 4: Now you’ll see the TradingView chart of the script
That’s all it takes to upgrade your trading strategy to the next level.
What Are the Different Tools and Features of TradingView?
TradingView has a wide array of unique tools and other analysis features which make it a go-to for almost 50 million+ traders. Some of them are listed below:
Technical Indicators
Technical indicators are one of the most essential tools for determining entry and exit prices. On TradingView, traders can choose from more than 100 technical indicators to analyse price trends and make the right decision. Some of them are - Moving Average Convergence / Divergence (MACD), Relative Strength Index (RSI), Bollinger Bands, Moving Averages (MA), candlestick pattern recognition, etc.
Advanced Charts
Another important tool when it comes to technical analysis is charts. They help traders examine the historical data of their target assets and trace their highs, lows, moving averages, etc. This enables them to gain insight into the price movements and predict their future patterns. TradingView offers advanced charts like Kagi, Renko, Heikin Ashi, candlesticks and more. Furthermore, users can make customised multi-chart layouts to simultaneously compare data of various time frames or assets.
Custom Trading Alerts
A unique feature of TradingView is that users can set custom trading alerts for various factors like technical indicators, price levels, specific events, etc. This helps them stay notified of drastic price movements, thus enabling them to take quick action. Traders can set alerts like PUSH notifications, email-to-SMS alerts, visual popups, audio signals and more.
Pine Scripts
TradingView’s Pine ScriptTM programming language allows users to create their own alerts, strategies and indicators. This enables traders to customise their trading experience as per their needs, thus improving their overall performance.
Drawing Tools
Adding annotations to charts is an effective way for traders to perform technical analysis. Thus, TradingView offers a suite of drawing tools like Fibonacci retracements, trend lines, support/resistance levels, etc., to assist users in tracking price patterns effectively.
Financial Analysis
When it comes to conducting financial analysis, TradingView is an all-rounder solution for users. This is because it provides fundamental analysis tools like historical data of companies, financial statements, valuation ratios and analysis, etc. Furthermore, it covers several asset classes like stocks, bonds, futures, indices, crypto, forex and the world economy.
Who Should Use TradingView?
TradingView combines a comprehensive charting system, advanced technical and fundamental analysis tools and an interactive social network that connects the global financial community. Thus, TradingView charts are suitable for new and veteran traders alike. Newbies can use the charts to analyse the market, which can help improve their trading strategies. Coming to seasoned traders, these individuals can take advantage of TradingView charts to rank up their trades. Additionally, TradingView offers around 100,000 customised strategies and indicators. This allows traders to analyse market movements through different lenses and make decisions accordingly.
How Can Samco Help You?
It is needless to state the importance of TradingView for new and experienced traders alike. However, to get the benefits of this platform, you need to select a brokerage platform that has TradingView integration. In this regard, the New-gen Samco mobile app can be an excellent choice. The app lets you easily shift between ChartIQ and TradingView charts and live-track the price movements of your target assets. What’s more, the seamless integration between the two platforms allows you to execute your trades immediately when the market moves in your favour.
Now, to avail the advanced features of TradingView, you usually need to opt for a subscription. But you can get a free TradingView subscription worth ₹15,540 by opening a Demat account with Samco.
Conclusion
It is important for traders to use various types of stock charts to analyse market sentiments and plan the entry and exit points accordingly. In this regard, TradingView, one of the most popular charting websites in the world, helps both novice and expert traders immensely. The New-Gen Samco Mobile app lets you seamlessly switch between ChartIQ and TradingView, offering you the opportunity to maximise your stock market returns. So what are you waiting for?
Join Samco today and start your stock market journey with confidence. Click here to open your free Demat account with Samco now.


 Easy & quick
Leave A Comment?