

Introduction
Every candle tells a story the story of market psychology.
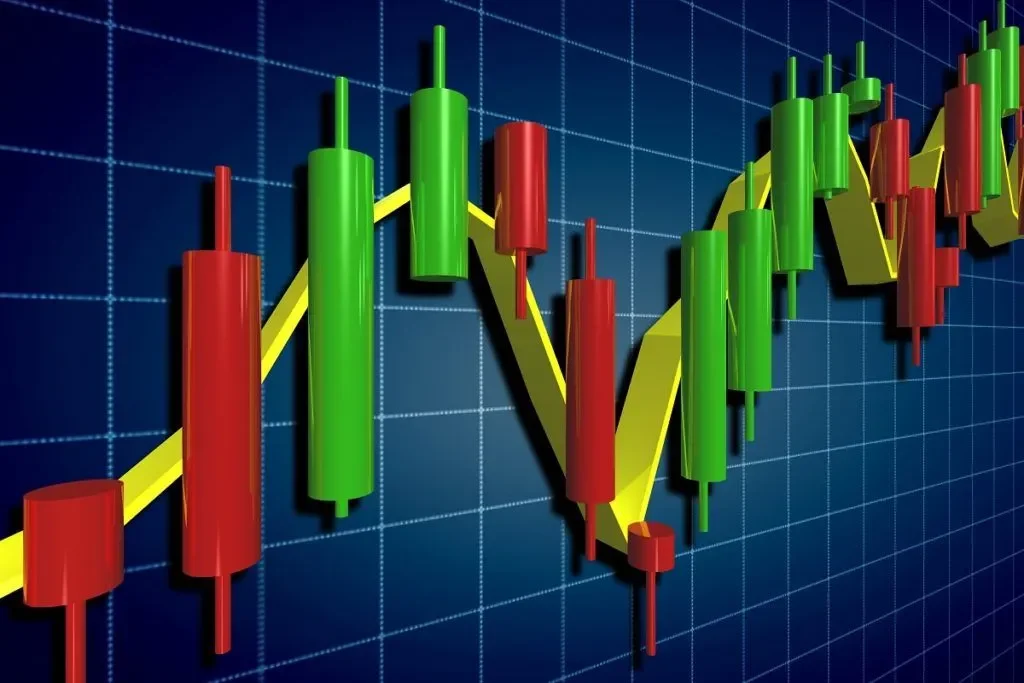
Among all tools in technical analysis, candlestick charts stand out as one of the most reliable and visually intuitive ways to interpret price action. Developed in 18th-century Japan by a rice trader named Munehisa Homma, these charts have guided traders for centuries and remain the foundation of modern trading systems worldwide.
Today, Japanese candlesticks are used by equity, forex, and options traders alike to identify market trends, reversals, and continuation patterns with precision. In this guide, we’ll break down what candlestick charts are, how to read them, and how various candlestick patterns help traders predict movements before they happen.
What Is a Candlestick Chart?
A candlestick chart represents price movement over a defined period it could be a minute, an hour, a day, or even a week. Each “candle” summarises four crucial data points:
- Open: The price at which the period began.
- High: The highest price reached.
- Low: The lowest price reached.
- Close: The final price at the end of that period.
Structure of a Candle
A single candlestick consists of:
- Body: The rectangular portion showing the range between open and close.
- Wick (or Shadow): The thin line extending from the body, representing highs and lows.
- Colour: Indicates sentiment
- A green (or white) candle means the price closed higher than it opened (bullish).
- A red (or black) candle means the price closed lower than it opened (bearish).
Example visual (text-based):
| ← High
|
[███] ← Body (Open to Close)
| ← Low
Candlestick charts are preferred over line or bar charts because they offer instant visual insight into market emotion who's in control: buyers or sellers.
Understanding Japanese Candlestick Patterns
Japanese candlestick patterns are combinations of one or more candles that signal potential changes in trend direction or continuation. Each pattern captures the psychology between bulls and bears, fear, greed, hesitation, and conviction, all reflected in price behaviour.
For instance, when a candle shows a long lower wick and a small body near the top, it signals that buyers have pushed the price up after strong selling, a possible reversal signal. Similarly, large bodies with small wicks show strong momentum in one direction.
These patterns can form across any timeframe, intraday, daily, weekly, or monthly, making them extremely versatile for all trading styles, from scalping to swing trading.
Let’s explore the main types of candlestick chart patterns that every trader should know.
Types of Candlestick Patterns
Candlestick patterns are broadly divided into bullish (signals potential upward reversal) and bearish (signals potential downward reversal) types.
- Bullish Candlestick Patterns
- Hammer
- Small body near the top with a long lower wick.
- Indicates that sellers drove the price down, but buyers regained control by the close.
- Seen after a downtrend, suggesting a potential rebound.
2. Bullish Engulfing
- Two-candle pattern.
- A small red candle is followed by a large green candle that completely engulfs the previous body.
- Shows strong buying pressure and possible trend reversal.
- Morning Star
- Three-candle pattern: a large red candle, a small indecisive candle (doji or spinning top), and a large green candle.
- Appears after a downtrend, signaling the transition from selling to buying momentum.
- Piercing Pattern
- The first candle is long and red; the second is green and closes above the midpoint of the previous candle.
- Indicates that buyers are returning after a decline, suggesting short-term reversal strength.
- Bearish Candlestick Patterns
- Shooting Star
- Small body near the bottom with a long upper wick.
- Appears after an uptrend and signals potential bearish reversal.
2. Bearish Engulfing
- Opposite of Bullish Engulfing.
- A small green candle followed by a large red candle that engulfs it entirely.
- Suggests strong selling momentum.
- Evening Star
- Mirror image of the Morning Star.
- A large green candle, followed by a small neutral candle, then a large red candle.
- Signals the end of an uptrend.
- Dark Cloud Cover
- Two-candle pattern where a red candle opens above the prior green candle’s high but closes below its midpoint.
- Indicates rising selling pressure and a potential trend reversal.
Continuation vs. Reversal Patterns
Candlestick patterns can either reverse an existing trend or continue it.
- Reversal Patterns: Indicate a possible change in trend direction.
Examples — Hammer, Shooting Star, Engulfing, Morning/Evening Star. - Continuation Patterns: Suggest that the current trend will persist.
Examples — Rising Three Methods (bullish) and Falling Three Methods (bearish).
Traders often confirm these signals with technical indicators like RSI, MACD, or moving averages to improve accuracy.
How to Read and Interpret Candlestick Charts
Reading a candlestick chart is a step-by-step process:
- Identify the trend: Observe whether prices are moving upward, downward, or sideways.
- Spot patterns: Look for single, double, or triple-candle formations that match known types.
- Confirm with volume: Rising volume strengthens pattern reliability.
- Use supporting indicators: Combine with RSI or MACD to validate signals.
- Plan entry and exit: For example, a Bullish Engulfing at a strong support level may indicate a good buying point, with a stop-loss just below the pattern low.Importance of Candlestick Charts in Technical Analysis
Candlestick charts simplify the complex world of price action into a visual language that’s easy to interpret.
They help traders:
- Identify precise entry and exit points.
- Recognise early trend reversals before they appear on lagging indicators.
- Gauge market sentiment in real time.
When combined with volume or moving averages, candlestick patterns become one of the best indicators for option trading and short-term strategies. Their strength lies in clarity — even beginners can spot patterns without complex formulas.
Common Mistakes to Avoid While Reading Candlestick Patterns
Even though candlesticks are simple, misinterpretation is common. Watch out for these mistakes:
- Ignoring the broader trend: Always analyze patterns within the larger trend context.
- Relying on single candles: One candle alone rarely tells the full story. Wait for confirmation.
- Misreading consolidation phases: Avoid overtrading when price moves sideways.
- Falling for false breakouts: Confirm with support, resistance, or indicator signals.
- Skipping confirmation tools: Candlestick patterns work best with other elements like RSI, MACD, or moving averages.
Pro Tip: Draw trendlines and moving averages along with candlestick formations. A Bullish Engulfing supported by a rising 20-DMA is far more reliable than one appearing in isolation.
Real-Life Example: Using Candlestick Analysis in Trading
Imagine Nifty has been falling for five consecutive sessions, and a Hammer pattern forms near a major support level of 24,000. The long lower wick shows sellers tried to push prices down, but buyers regained control.
- The next session opens higher with increasing volume — confirmation of buying interest.
- A trader enters a long position or buys near-the-money call options.
- Stop-loss is placed below the Hammer’s low.
- As the trend reverses, the following candles turn green, validating the pattern.
This example shows how understanding Japanese candlestick charts gives traders an early advantage in predicting short-term direction changes.
Conclusion
Every candlestick represents a battle between buyers and sellers — and learning to read that battle gives traders a unique edge. Japanese candlestick patterns are not just visual tools; they are windows into market psychology.
From simple setups like the Hammer and Shooting Star to complex formations like the Morning and Evening Star, these patterns are foundational for anyone learning how to do technical analysis.
Used wisely, they help traders identify high-probability setups, manage risk better, and make more confident trading decisions.


 Easy & quick
Leave A Comment?