

Introduction
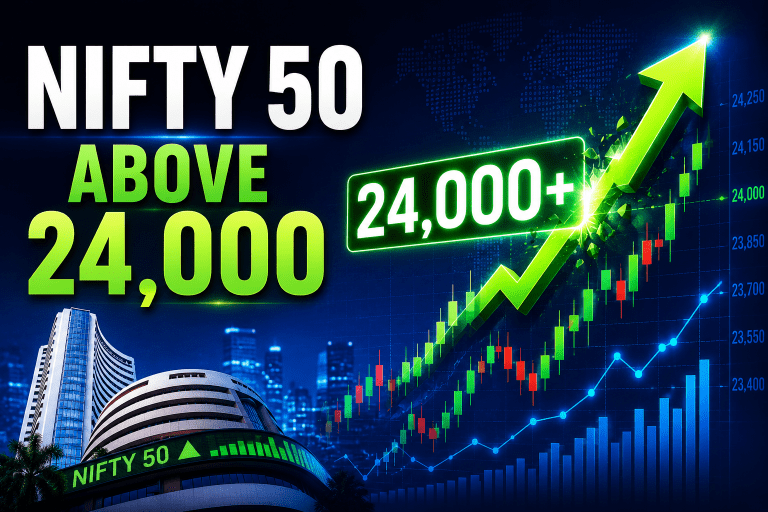
The Nifty 50 has reclaimed the psychologically important 24,000 level, signaling improving market sentiment after recent volatility. The move comes amid easing crude oil prices, strengthening global cues and renewed buying interest across key sectors.
For market participants, the 24,000 mark is more than just a round number. Psychological levels often influence trader behavior and can become important zones for support, resistance and trend confirmation. A sustained move above such levels may indicate strengthening momentum, while failure to hold them could lead to renewed consolidation.
As investors assess the broader market outlook, attention has shifted to the next key technical levels that could influence the Nifty’s near-term trajectory.
Key Highlights
- Nifty 50 moved above the important 24,000 level.
- Lower crude oil prices improved market sentiment.
- Banking, financial and energy stocks supported the rally.
- Technical analysts are monitoring nearby resistance zones.
- Market participants are watching inflation, crude oil and global developments.
Why Is the 24,000 Level Important for Nifty 50?
Psychological levels play an important role in technical analysis.
Round-number milestones such as:
- 20,000
- 22,000
- 24,000
- 25,000
often become areas where market participants reassess risk and positioning.
When an index moves above an important psychological level, traders frequently look for confirmation through sustained price action and trading volumes before assuming a stronger trend has emerged.
The recent move above 24,000 therefore represents an important development from a technical perspective.
What Factors Supported the Nifty Rally?
Several macroeconomic and market-related developments contributed to the positive momentum.
Easing Crude Oil Prices
India remains one of the world’s largest crude oil importers.
Lower oil prices may:
- Reduce inflationary pressures
- Improve corporate profitability
- Support consumer spending
- Ease pressure on the current account deficit
These factors generally contribute positively to market sentiment.
Improved Global Market Sentiment
Positive developments in international markets often influence domestic investor confidence.
Global equity strength, improving risk appetite and reduced geopolitical concerns can encourage broader participation in equity markets.
Strong Participation Across Key Sectors
Recent market gains have been supported by participation from:
- Banking stocks
- Financial services companies
- Energy stocks
- Infrastructure-related businesses
Broad-based participation is often considered healthier than rallies driven by a limited number of large-cap stocks.
Nifty 50 Technical Outlook: Key Levels to Watch
Technical analysis focuses on areas where buying or selling activity may emerge.
Immediate Support Zone
The first important support area is located around:
23,800–23,900 Zone
This area may act as a short-term support region following the recent breakout.
If the index continues to trade above this range, bullish momentum may remain intact.
Major Support Zone
23,600–23,700 Region
This zone has previously acted as an important technical base.
A sustained break below this region could weaken short-term sentiment and increase market volatility.
Immediate Resistance Zone
24,200–24,400 Range
This area may emerge as the next important hurdle following the move above 24,000.
Market participants often monitor resistance zones to evaluate whether buying momentum remains strong enough to support further advances.
Higher Resistance Area
24,700–25,000 Zone
Several technical analysts have identified this broader range as an important area where additional supply could emerge.
A decisive move above this zone could strengthen the medium-term technical structure.
What Does Technical Analysis Suggest?
Technical indicators provide additional context regarding market momentum.
Moving Average Structure
Many analysts track:
- 20-Day Moving Average
- 50-Day Moving Average
- 100-Day Moving Average
- 200-Day Moving Average
When the index trades above important moving averages, it is often interpreted as a sign of improving trend strength.
Relative Strength Index (RSI)
The RSI is commonly used to measure momentum.
A rising RSI generally indicates strengthening buying momentum, while extreme readings may suggest overbought conditions.
Recent momentum indicators have shown signs of improvement following the breakout above 24,000.
Volatility Trends
The India VIX, commonly referred to as the market’s fear gauge, is another important indicator.
Lower volatility levels often support risk appetite and improve investor confidence.
Market participants continue to monitor volatility trends alongside price action.
Key Factors That Could Influence Nifty’s Next Move
Crude Oil Prices
Oil prices remain one of the most important variables for the Indian economy.
Any sharp reversal in crude prices could affect inflation expectations and market sentiment.
RBI Monetary Policy
Interest-rate expectations continue to influence:
- Banking stocks
- Financial companies
- Market valuations
Policy commentary from the Reserve Bank of India remains a key variable.
Foreign Institutional Investor (FII) Flows
Institutional investment activity often plays a significant role in determining market direction.
Sustained inflows can support liquidity and broader market participation.
Corporate Earnings
Quarterly earnings remain one of the most important drivers of long-term market performance.
Investors continue to assess:
- Revenue growth
- Profit margins
- Future guidance
- Sector outlooks
Risks Investors Should Monitor
Despite improving sentiment, several risks remain.
Global Geopolitical Developments
Unexpected geopolitical events can increase volatility across financial markets.
Inflation Pressures
Persistent inflation may influence monetary policy decisions and corporate profitability.
Currency Fluctuations
Movements in the Indian rupee can impact import costs and earnings outlooks.
Commodity Price Volatility
Changes in energy and commodity prices can influence sector performance and market sentiment.
Frequently Asked Questions (FAQs)
Why is the 24,000 level important for Nifty?
The 24,000 mark is considered a significant psychological and technical level that traders often monitor for trend confirmation and market sentiment.
What are the key support levels for Nifty 50?
Analysts are monitoring the 23,800–23,900 zone as an immediate support area, followed by the broader 23,600–23,700 region.
What are the next resistance levels for Nifty?
Technical observers are watching the 24,200–24,400 range initially, followed by the broader 24,700–25,000 zone.
How do crude oil prices affect Nifty?
Lower crude oil prices may help reduce inflation, improve corporate margins and support overall market sentiment, particularly in an oil-importing economy such as India.
Can technical levels predict market direction?
Technical analysis identifies areas where buying and selling activity may occur. However, market movements are influenced by multiple factors and technical indicators should not be viewed as guarantees of future performance.
Conclusion
The Nifty 50’s move above the 24,000 mark represents an important technical development and reflects improving market sentiment. Lower crude oil prices, positive global cues and broad sector participation have contributed to the recent strength. While technical indicators suggest constructive momentum, investors should continue monitoring support and resistance zones, macroeconomic developments, institutional flows and corporate earnings to better understand the market’s evolving outlook.
Disclaimer: This article is intended solely for educational and informational purposes and should not be construed as investment advice, stock recommendations, research reports, or an invitation to buy, sell, or hold any securities.