What is breakout in the stock market in the study of technical analysis?
A breakout is a price movement of a stock or commodity beyond an identified level of resistance or support, which is usually followed by heavy volumes and an increased amount of volatility. Traders buy the stocks or commodities when the price breaks above a certain price level of resistance or ceiling or sell when it breaks below a level of support or floor. This is also called a confirming signal for a major move in the market. In practice, breakout is most commonly referred to a situation in which the price breaks out above a level of resistance and moves higher beyond the initial resistance. Quite often, stocks have huge moves once they breakout. A simple analogy would be an example of a bird being caged (resistance). As soon as the cage is released/opened the bird flies high and far beyond its resistance. Once resistance level is broken, it often becomes the next level of support when the asset experiences a correction or pullback. Most traders use chart patterns and other technical tools and indicators, such as trend lines, to identify possible resistances for stock prices that are likely to experience break outs. Similar price movements to the downside are more often referred to as breakdowns. A breakout backed by a good volume after a long consolidation period will give a bigger movement as compared to a breakout after a short period of consolidation. Technical chart patterns such as head and shoulder, triangles and flags that are near completion in their formation and signify upward price movements are also common spots for breakouts. Once price action makes a final movement to confirm the pattern, a price breakout usually follows.
How to identify breakout stocks in trading?
Entry Rules using breakout trading strategy: Generally for a short term trader breakout period of 21 days is used, for a positional trader breakout period of 55 days is used and for long term momentum investor breakout of 200 days is used to enter the trade. Jesse Livermore’s style of trading was of breakouts, he used to describe breakouts as “line of least resistance” that is, when prices move beyond breakout, there is no resistance and thereafter the price glides smoothly in that direction. [caption id="attachment_2297" align="aligncenter" width="1303"]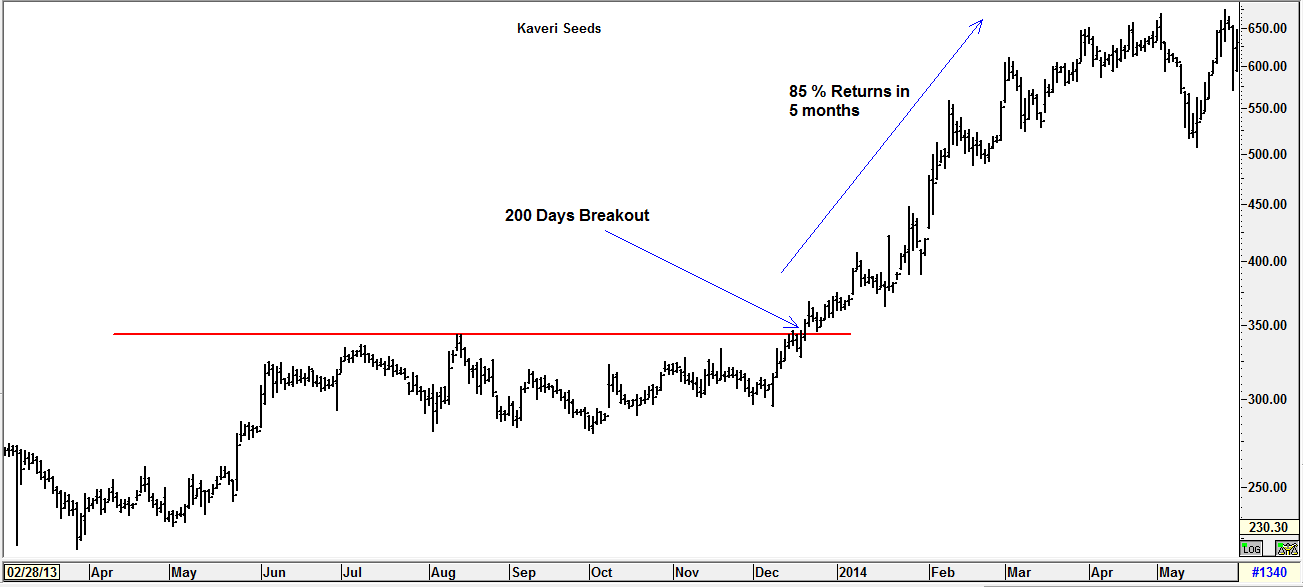 Stocks with big up move post breakout beyond defined resistance[/caption]
For Exits: Generally exit rules are defined on multiple basis, some use moving average crossovers, others use predefined profit targets depending on the initial risk undertaken and rewards expected, still others follow breakout on the opposite side by half the original breakout period. For example those who use 200 days as breakout entry signal, will use 100 days breakout on the opposite side to book profit. But this requires proper back testing and optimization on the number of days to be used for reversing the trade.
[caption id="attachment_2298" align="aligncenter" width="1297"]
Stocks with big up move post breakout beyond defined resistance[/caption]
For Exits: Generally exit rules are defined on multiple basis, some use moving average crossovers, others use predefined profit targets depending on the initial risk undertaken and rewards expected, still others follow breakout on the opposite side by half the original breakout period. For example those who use 200 days as breakout entry signal, will use 100 days breakout on the opposite side to book profit. But this requires proper back testing and optimization on the number of days to be used for reversing the trade.
[caption id="attachment_2298" align="aligncenter" width="1297"]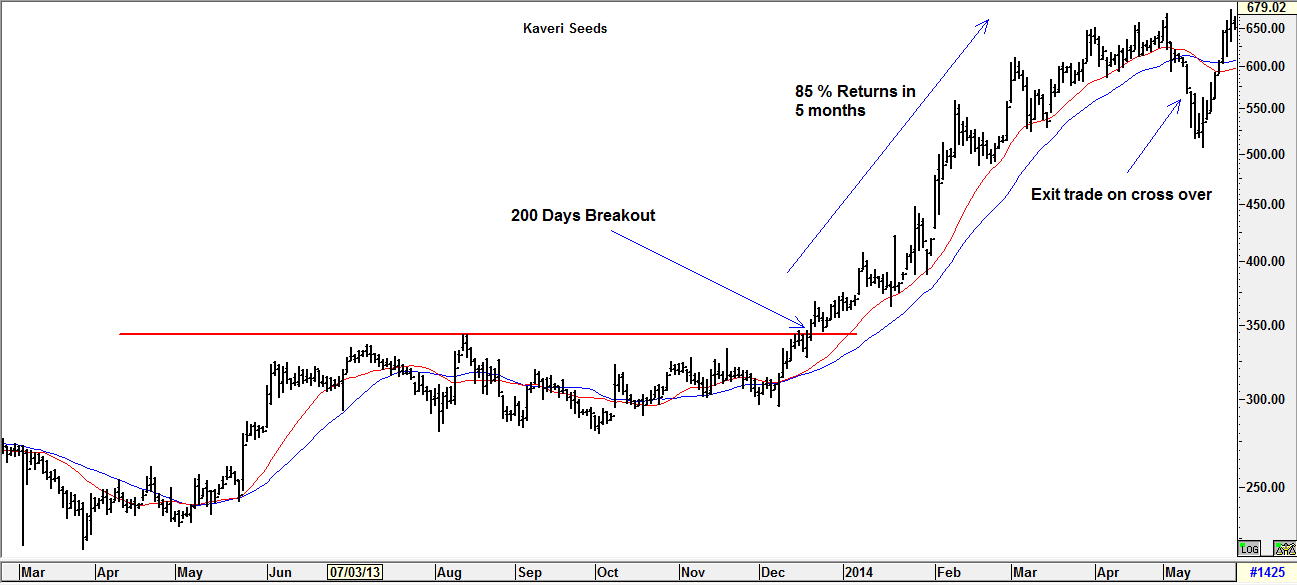 Exit Breakout trades when shorter moving averages crossover longer moving averages[/caption]
For Stop Loss: Those who use breakout as a strategy, generally use 2 ATR as stop loss for exit. ATR stands for Average True Range, in a simple sense ATR is the high and low range of the day for x number of days. Generally 14 days average of ATR is taken for calculation. Another way to keep stop loss is to identify support or resistance and place stop loss below or above that level.
[caption id="attachment_2299" align="aligncenter" width="1291"]
Exit Breakout trades when shorter moving averages crossover longer moving averages[/caption]
For Stop Loss: Those who use breakout as a strategy, generally use 2 ATR as stop loss for exit. ATR stands for Average True Range, in a simple sense ATR is the high and low range of the day for x number of days. Generally 14 days average of ATR is taken for calculation. Another way to keep stop loss is to identify support or resistance and place stop loss below or above that level.
[caption id="attachment_2299" align="aligncenter" width="1291"]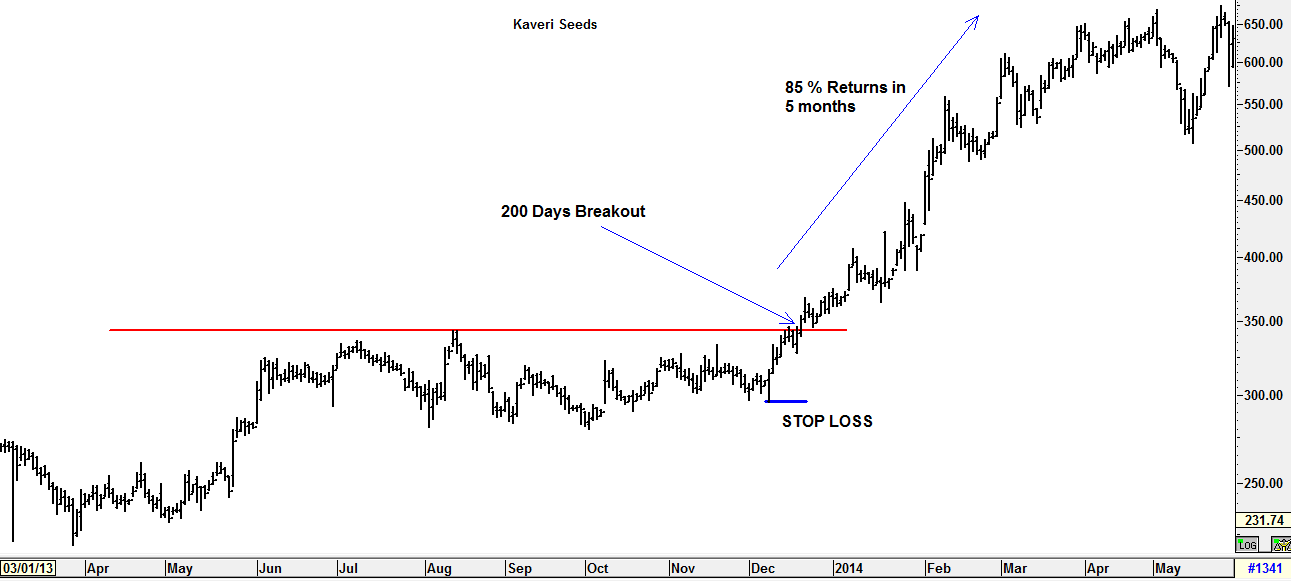 Defining stop losses in breakout trades[/caption]
Pitfalls: Breakouts are profitable when the markets are trending strongly, and are a nightmare when the markets are in sideways or corrective modes. It would be difficult to know exactly when the correction is over and therefore every breakout has to be attempted because no one knows when a powerful move will start. Thus trading breakout requires lot of steel nerves and the ability to take whipsaw losses. When there are series of whipsaw losses, it is then the time ripe for a powerful move in the making, and therefore the trader must have the stomach to pull the trigger inspite of continuous whipsaw losses that he/she had. Significant news events may also cause price breakouts. These breakouts are more unpredictable and depend on the effects that the news has on a particular security, and therefore may be avoided if it not fundamentally solid.
[caption id="attachment_2300" align="aligncenter" width="1294"]
Defining stop losses in breakout trades[/caption]
Pitfalls: Breakouts are profitable when the markets are trending strongly, and are a nightmare when the markets are in sideways or corrective modes. It would be difficult to know exactly when the correction is over and therefore every breakout has to be attempted because no one knows when a powerful move will start. Thus trading breakout requires lot of steel nerves and the ability to take whipsaw losses. When there are series of whipsaw losses, it is then the time ripe for a powerful move in the making, and therefore the trader must have the stomach to pull the trigger inspite of continuous whipsaw losses that he/she had. Significant news events may also cause price breakouts. These breakouts are more unpredictable and depend on the effects that the news has on a particular security, and therefore may be avoided if it not fundamentally solid.
[caption id="attachment_2300" align="aligncenter" width="1294"]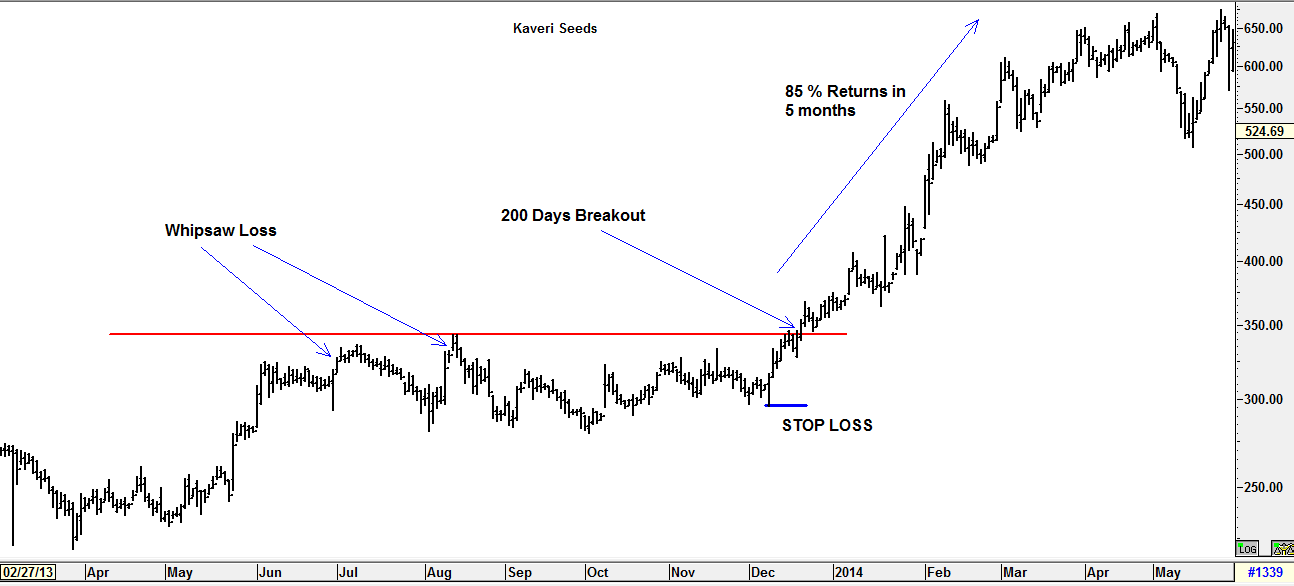 Negatives of Break out trading strategies due to Whipsaw losses[/caption]


 Easy & quick
Leave A Comment?