In this article, we will discuss
- All about Harmonic Price Patterns for Stock Traders
- What Are Harmonic Price Patterns?
- Understanding Fibonacci Ratios in Harmonic Price Patterns
- Common Harmonic Price Patterns
- Conclusion

All about Harmonic Price Patterns for Stock Traders
Stock market traders rely on financial chart patterns as part of technical analysis to predict trends and future market movements. By anticipating future market moves, these patterns enable traders to spot possible trends or price shifts and employ a profitable trading strategy effectively. Examples of common price patterns include symmetrical triangles, cups and handles, double bottoms and harmonic patterns. In this regard, harmonic price patterns are a powerful tool that takes geometric trend analysis to the next level! They can be used to pinpoint exact trend reversal points - but only if you know how to use them correctly. The following sections will cover all about common harmonic patterns and how to spot them.What Are Harmonic Price Patterns?
Harmonic patterns are specific chart patterns that can help you understand price action and predict the direction of price movements. These are geometric patterns on traditional financial charts that are quantified by Fibonacci calculations to identify key reversal points, extensions and retracements. Patterns like the “Gartley”, “Bat”, “Shark”, “Crab” and “5.0” are some of the popular harmonic price patterns. Each pattern has a specific bullish and bearish formation and Fibonacci ratio that must be observed by traders for the pattern to be valid and indicate future price action. Precise calculations based on Fibonacci ratios remove a lot of subjectivity prevalent in traditional chart patterns and make harmonic patterns quite trustworthy. So, traders who are experienced in identifying these chart patterns can use them to make informed decisions.Understanding Fibonacci Ratios in Harmonic Price Patterns
As discussed above, harmonic price patterns are quantified using Fibonacci sequences. The Fibonacci series is a sequence of numbers arranged in such a way that each consecutive number is the sum of the previous two numbers in the series. The sequence goes as follows: 0, 1, 1, 2, 3, 5, 8, 13, 21, 34, 55, 89, 144, 233, 377, …. When you divide any number in the series by a number 1 place, 2 places or 3 places lower, you will get ratios like 1.618, 0.618 and 0.382, respectively. In the stock market, these ratios correlate to price-related retracements, extensions and turning points, which happen whenever there is a sharp upward or downward movement. The fundamental principle underlying harmonic patterns denotes that price movements follow the symmetry of the Fibonacci ratios. Traders can attempt to predict the future movement of stocks by identifying patterns of various magnitudes and durations and applying Fibonacci coefficients to them.Common Harmonic Price Patterns
Here are some of the most commonly used patterns in harmonic trading strategies:Gartley Pattern
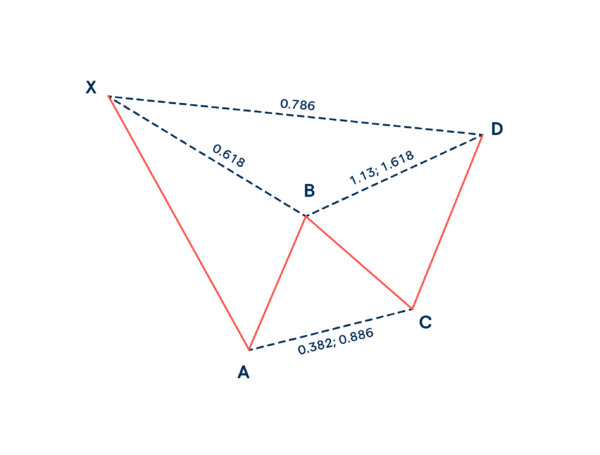 This pattern signifies a temporary trend reversal before continuing on its original course.
This is a 5-point bearish or bullish pattern developed by the founder of harmonic patterns, H M Gartley. These patterns resemble an ‘M’ or ‘W’ defined by 5 key points. Each pattern has 2 impulse swings and 2 retracement legs.
The Gartley pattern follows two key rules- first, the retracement from point B is 0.618 of XA and the retracement from point D is 0.786 of XA.
This pattern signifies a temporary trend reversal before continuing on its original course.
This is a 5-point bearish or bullish pattern developed by the founder of harmonic patterns, H M Gartley. These patterns resemble an ‘M’ or ‘W’ defined by 5 key points. Each pattern has 2 impulse swings and 2 retracement legs.
The Gartley pattern follows two key rules- first, the retracement from point B is 0.618 of XA and the retracement from point D is 0.786 of XA.
ABCD Pattern
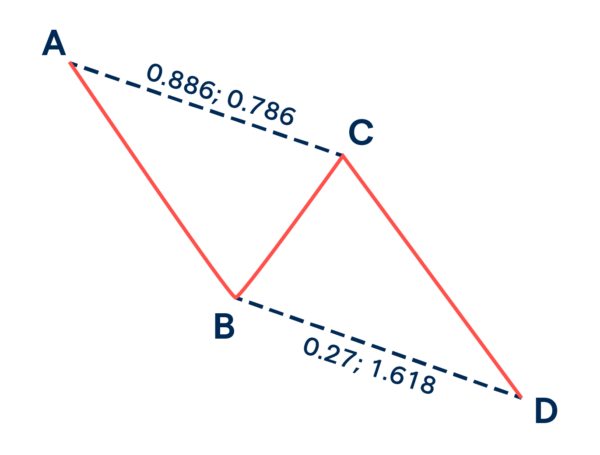 This pattern denotes the natural harmonic trend of the market.
One of the easiest patterns to identify, the ABCD (or AB=CD) pattern is made of 4 points and 3 movements. The points include A, B, C and D which create 3 movements: AB- an impulsive movement, BC- a corrective movement and CD- another impulsive movement in the same direction as AB.
The AB leg is of the same length as CD, while the BC leg is precisely 0.168 of AB.
This pattern denotes the natural harmonic trend of the market.
One of the easiest patterns to identify, the ABCD (or AB=CD) pattern is made of 4 points and 3 movements. The points include A, B, C and D which create 3 movements: AB- an impulsive movement, BC- a corrective movement and CD- another impulsive movement in the same direction as AB.
The AB leg is of the same length as CD, while the BC leg is precisely 0.168 of AB.
Bat Pattern
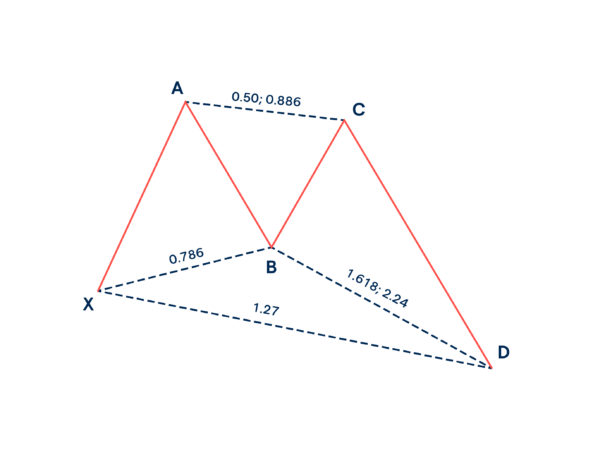
 The bat pattern can often foretell a sharp price reversal in the market. It is similar to the Gartley pattern in appearance, with some key differences in the Fibonacci ratios.
It has one more leg and a point called X than the ABCD pattern. Here, the XA leg leads the BC retracement movement, which is 50% of XA. The CD leg must be as low as 1.618 of the BC leg and as high as 2.618.
The bat pattern can often foretell a sharp price reversal in the market. It is similar to the Gartley pattern in appearance, with some key differences in the Fibonacci ratios.
It has one more leg and a point called X than the ABCD pattern. Here, the XA leg leads the BC retracement movement, which is 50% of XA. The CD leg must be as low as 1.618 of the BC leg and as high as 2.618.
Butterfly Pattern
Crab Pattern
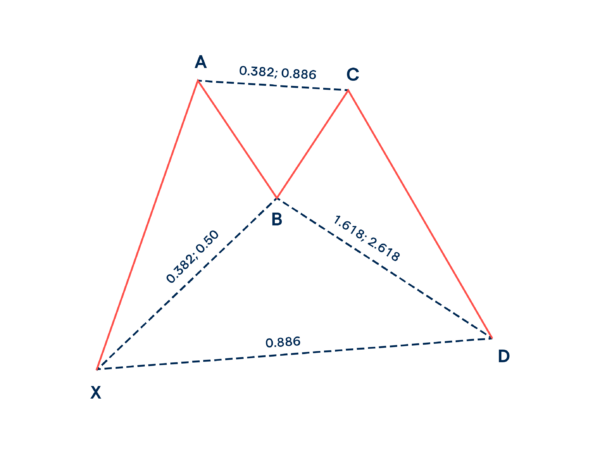
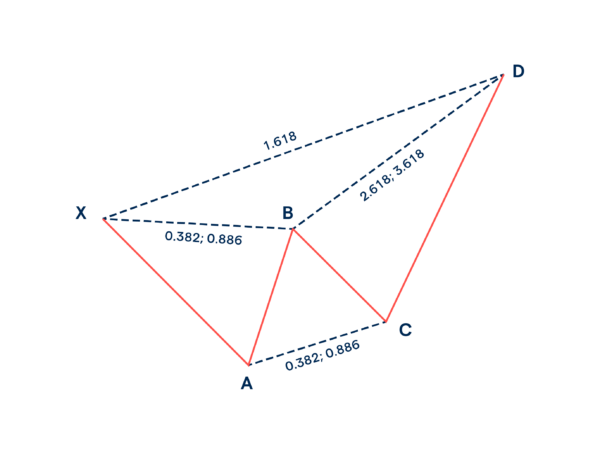 The crab pattern is an extension structure that helps to identify the beginning of a new trend.
It also follows the XA, AB, BC and CD pattern, with the most important feature being the 1.618 of XA which defines the PRZ (Potential Reversal Zone).
In the bullish crab pattern, the XA leg forms due to a sharp increase in price from point X to A. The AB leg retraces 38.2% to 61.8% of XA, followed by an extreme projection of BC, which identifies a potential reversal. A bearish pattern of crab forms when there's a dip from points X and A, followed by a modest rise and fall and a sharp rise to point D.
The crab pattern is an extension structure that helps to identify the beginning of a new trend.
It also follows the XA, AB, BC and CD pattern, with the most important feature being the 1.618 of XA which defines the PRZ (Potential Reversal Zone).
In the bullish crab pattern, the XA leg forms due to a sharp increase in price from point X to A. The AB leg retraces 38.2% to 61.8% of XA, followed by an extreme projection of BC, which identifies a potential reversal. A bearish pattern of crab forms when there's a dip from points X and A, followed by a modest rise and fall and a sharp rise to point D.


 Easy & quick
Leave A Comment?