

In this article, we will discuss
- Importance of Understanding Share Market Charts and Stock Trends
- Key Overview of Share Market Chart
- Types of Share Market Charts
- How to Read Each Type of Share Market Chart?
- Common Fundamental Indicators
- Combining Technical and Fundamental Analysis
- Different Share Market Chart Patterns
- How to Analyze Share Market Chart Patterns?
Importance of Understanding Share Market Charts and Stock Trends
Knowing share market charts and stock patterns is critical for anyone who wants to invest in or trade stocks. Here are some of the reasons why it is vital:- Understanding share market charts and stock trends is crucial for smart investment decisions.
- Share market charts show the stock's performance over time. This helps investors keep track of the stock's ups and downs.
- By looking at stock trends, investors can find patterns and make predictions about how the stock will do in the future.
- Investors can learn much about a stock's momentum and growth potential by understanding key indicators like moving averages, RSI, and Bollinger Bands.
- Share market charts and stock trend analysis can help investors minimize risk and maximize their investments.
Key Overview of Share Market Chart
As you can see, the standard chart visually represents the stock price's performance over a specified period, in addition to the following data and options:- Company Name
- Current share price
- The time frame of the stock's performance –
-
- One day (1D)
- Five days
- One month (1M)
- Three months
- Six months
- An entire year (1y)
- Five decades (5Y)
- Chart changing option
- Advanced study option
- Draw option
- Save option
- Crosshair
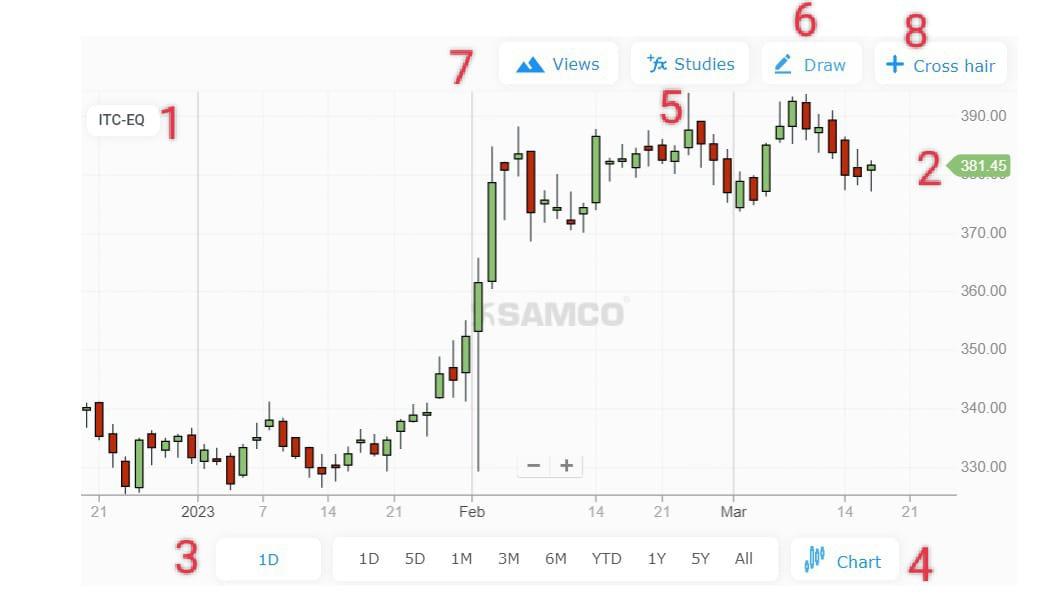 Source: https://www.samco.in/stocks/itc-ltd-share-price
Types of Share Market Charts
1. Line Chart
- A line chart shows how the price of a stock at the end of the day has changed over time.
- The x-axis shows time, and the y-axis shows the stock price.
- By drawing a line between the stock's closing prices, investors can see the stock's overall trend.
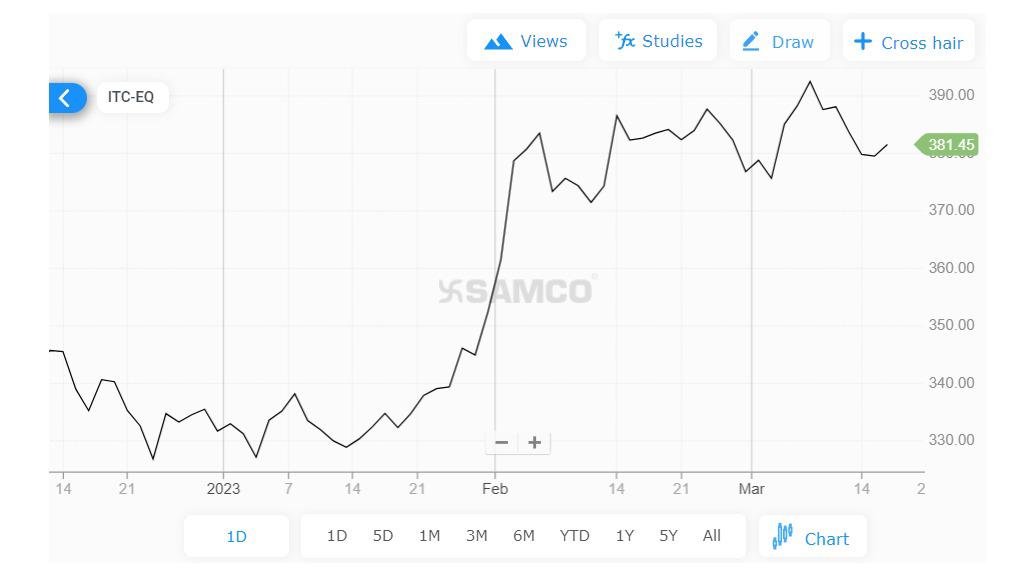 Source: https://www.samco.in/stocks/itc-ltd-share-price
2. Bar Chart
- A bar chart shows a stock's high, low, opening, and closing prices over time.
- The vertical line shows the high and low prices, while the horizontal lines show the opening and closing prices.
- The bar's length shows the price range during that time.
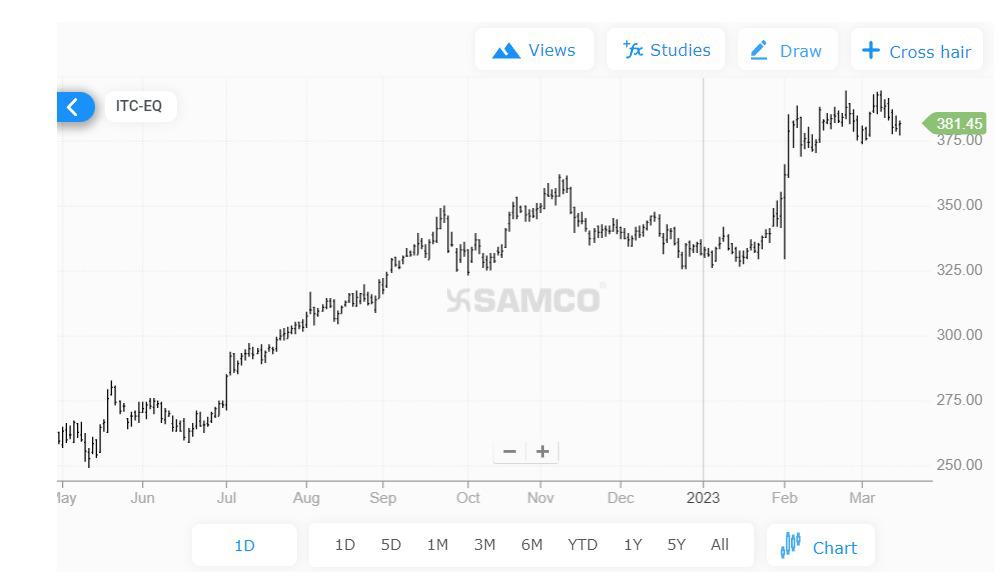 Source: https://www.samco.in/stocks/itc-ltd-share-price
3. Candlestick Chart
- A candlestick chart is like a bar chart, but it gives you more data.
- The candlestick's body shows the opening and closing prices, while the wicks, or shadows, show the high and low prices.
- If the stock price has gone up, the candlestick will be green. If the price has gone down, the candlestick will be red.
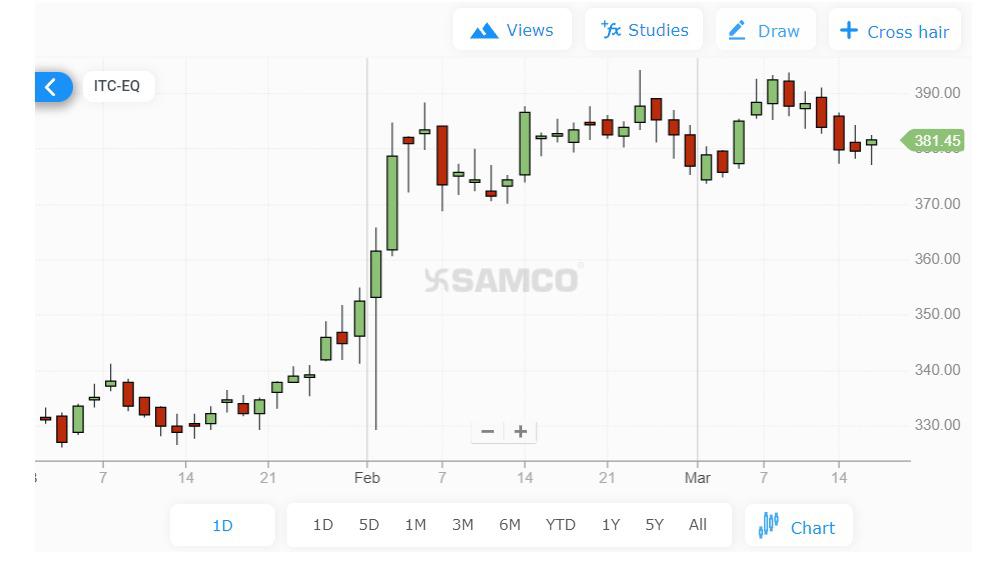 Source: https://www.samco.in/stocks/itc-ltd-share-price
How to Read Each Type of Share Market Chart?
Technical Analysis
The technical analysis predicts financial price movements based on past price movements. Technical analysis, like weather prediction, cannot foresee the future. Instead, basic analysis can help buyers predict price changes. The technical analysis applies to stocks, ETFs, commodities, futures, and other trading assets that supply and demand affect. Price data, or "market action," includes a security's open, high, low, close, volume, and open interest over a given period. The period can be interim (1-minute, 5-minute, 10-minute, 15-minute, 30-minute, or hourly), daily, weekly, or monthly price data and last a few hours or many years.Common Technical Indicators
Moving Averages
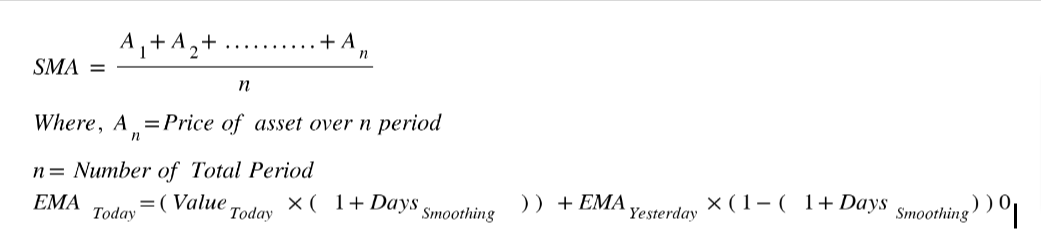
Moving averages help traders spot stock price trends in their technical analysis. A moving average is determined by taking a stock's price over 50 or 200 days. The resulting line on the chart represents the stock's average price over that period. Simple moving averages (SMA) and exponential moving averages (EMA) are two moving averages. (EMA). Adding the ending values a certain number of times and dividing by that number yields a basic moving average. An exponential moving average responds faster to stock price shifts by weighing current values more.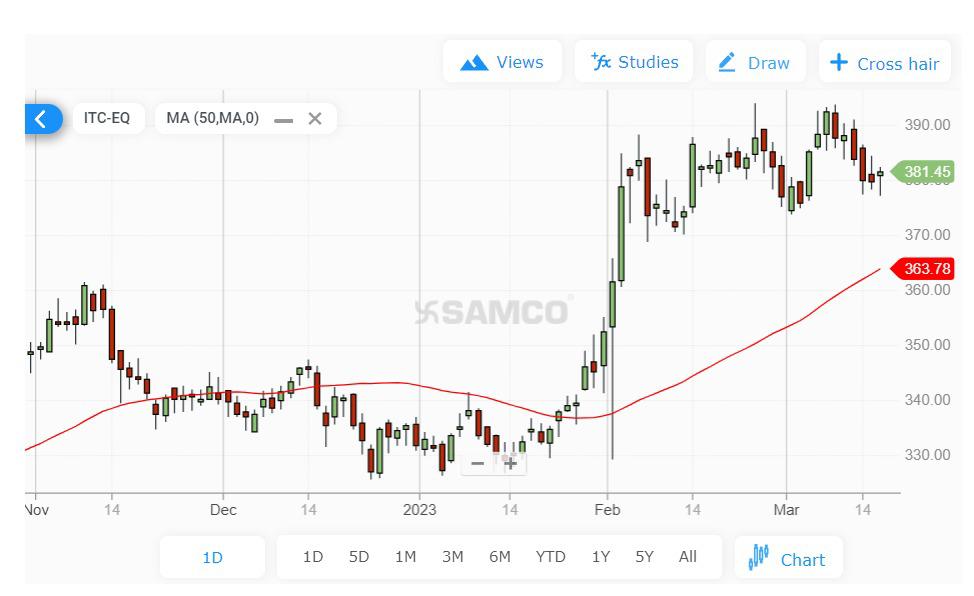 Source: https://www.samco.in/stocks/itc-ltd-share-price
Formulas
Source: https://www.samco.in/stocks/itc-ltd-share-price
Formulas
Relative Strength Index (RSI)
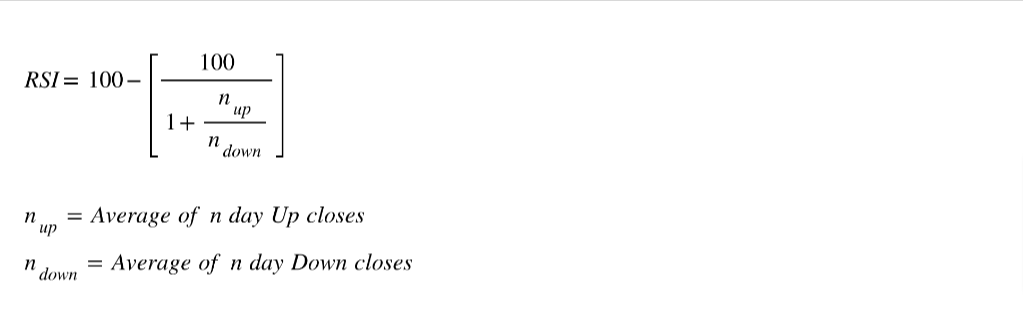
The RSI has many applications. The indicator fluctuates between 0 and 100 and plots recent price gains versus losses. RSI values indicate movement and trend power. Overbought and bearish indicators are RSI's primary use. Overbought assets may fall when RSI rises above 70. Oversold assets may rise when the RSI is below 30.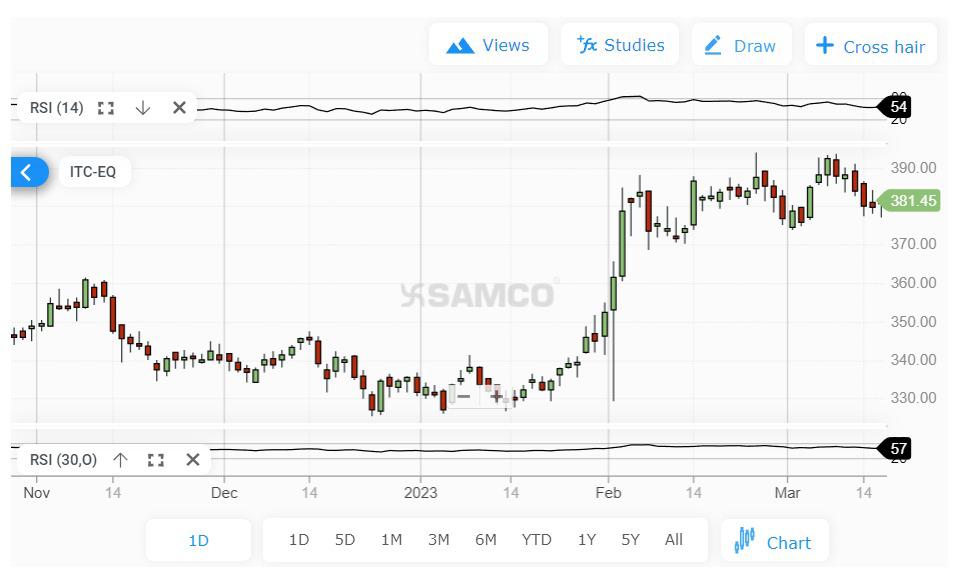 Source: https://www.samco.in/stocks/itc-ltd-share-price
Formula
Source: https://www.samco.in/stocks/itc-ltd-share-price
Formula
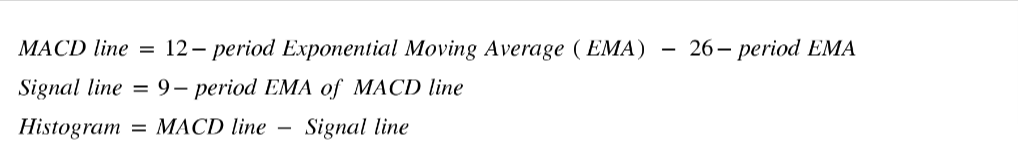
Moving Average Convergence Divergence (MACD)
Technical indicators like the Moving Average Convergence Divergence (MACD) can help traders spot market trend reversals and entry/exit marks. This indicator has two lines: MACD and signal. The MACD line is determined by deducting the 26-day exponential moving average (EMA) from the 12-day EMA, while the signal line uses a 9-day MACD line EMA. MACD and signal lines are versatile. When the MACD line passes above the signal line, it's a strong sign that the price may rise. When the MACD line passes below the signal line, it's an adverse sign that the price may be starting a decline.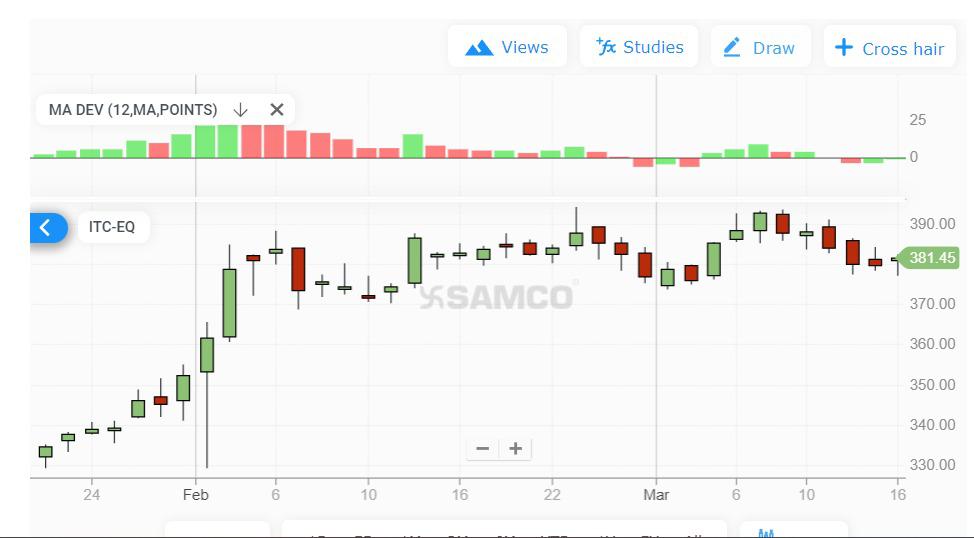 Source: https://www.samco.in/stocks/itc-ltd-share-price
Formula
Source: https://www.samco.in/stocks/itc-ltd-share-price
Formula
Bollinger Bands
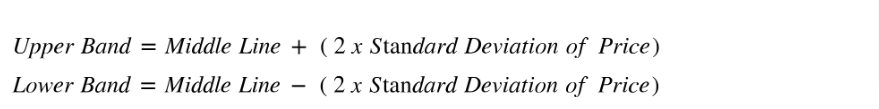
Bollinger Bands helps traders visualize asset volatility and price levels. Bollinger Bands have three lines: the middle line, an upper band, and a lower band. The middle line is a 20-period security price moving average. The upper and lower bands are two standard deviations from the middle line. The bands' width depends on the security's volatility. When the security's price moves closer to the upper band, it's overvalued; when it moves closer to the lower band, it's oversold. Bollinger Bands help traders spot to buy and sell signs and set stop-loss orders.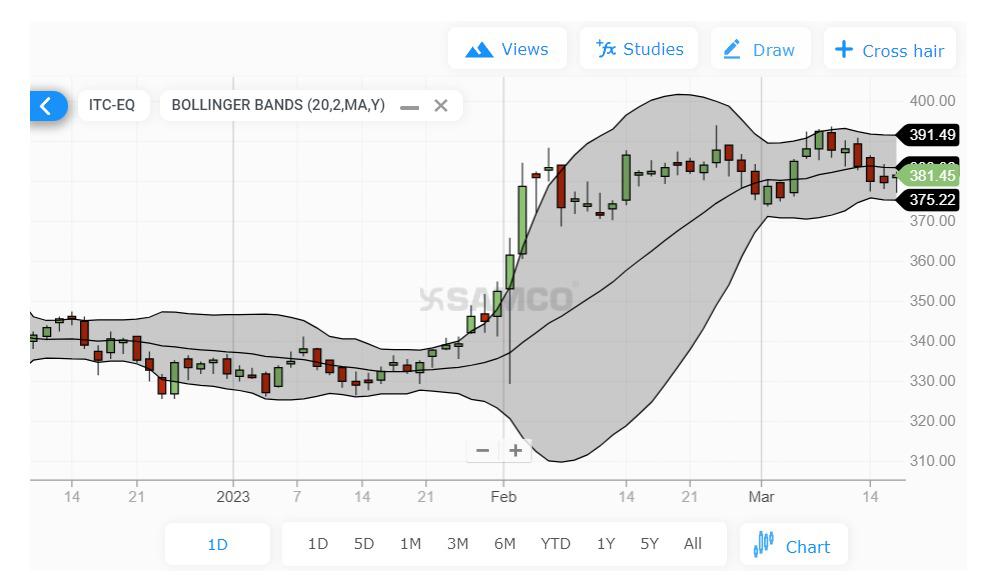 Source: https://www.samco.in/stocks/itc-ltd-share-price
Formula:
Source: https://www.samco.in/stocks/itc-ltd-share-price
Formula:
Fundamental Analysis
Fundamental analysis is a technique for determining the intrinsic value of a stock by analyzing its financial and economic factors, such as its revenue, earnings, assets, liabilities, and management. In contrast to technical analysis, which uses historical price and volume data to identify market patterns and trends, fundamental analysis focuses on a company's underlying health and performance.Common Fundamental Indicators
Earnings per share
Earnings per share (EPS) is a company's profit per common stock unit. It's determined by dividing the company's net income by its total shares. EPS shows investors a company's revenue and growth prospects. Investors may like a larger EPS because it suggests more profit per share. When assessing a company's financial health factors like income growth, cash flow, and debt levels are also essential.Price-to-earnings ratio (P/E ratio)
The P/E ratio is a company's stock price ratio to its earnings per share. It is a commonly used valuation metric that helps investors determine whether a stock is overvalued or undervalued relative to its peers.Price-to-book ratio (P/B ratio)
The P/B ratio highlights the ratio between a company's stock price to its book value, which is the value of its assets minus its liabilities. It evaluates whether a company is undervalued or overvalued relative to its net assets.Dividend yield
The dividend yield is the dividend paid per share divided by the current stock price. It measures a company's dividend policy and can be used to compare the yields of different dividend-paying stocks.Return on equity (ROE)
ROE measures a company's profitability that calculates how much profit a company generates for shareholder equity. It is a commonly used metric to assess the efficiency of a company's management.Debt-to-equity ratio (D/E ratio)
The D/E ratio measures a company's leverage, comparing its total debt to its equity. It evaluates a company's financial risk and can help investors determine whether it is financially sound.Combining Technical and Fundamental Analysis
When investing in the stock market, combining technical and fundamental analysis can be a powerful way to make smart choices. Based on past price and volume data, technical analysis can assist traders in locating possible entry and exit points in the market. In contrast, fundamental analysis can inform traders about a company's financial health and growth potential. One way to use both types of analysis together is to start with a fundamental company analysis. This can include looking at its financial records, management team, business trends, and other factors affecting its performance. You can then use this analysis to find stocks with good foundations and growth prospects. Once you've found possible stocks, you can use technical analysis to determine when to buy and sell. For example, you can use moving averages to find trends in a stock's price movement or momentum measures like the Relative Strength Index (RSI) to determine when the market is high or oversold. Mixing technical and fundamental analysis can be a powerful way to make smart business decisions in the stock market. Traders can find possible chances and risks in the market and make better financial choices using both types of analysis.Different Share Market Chart Patterns
| Share Market Chart Patterns | Description | Visulatization |
| Head and Shoulders | This chart pattern is observed when the price of a stock reaches three peaks, with the middle peak being higher than the other two. This trend is often seen as a sign that the stock's price may be about to drop. | 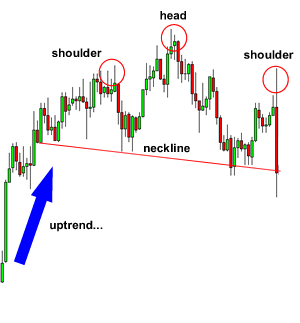 |
| Double Bottom | This chart pattern is created when a stock's price drops twice to about the same level and then goes up in between. This pattern is often bullish, indicating that the stock may be entering an uptrend. | 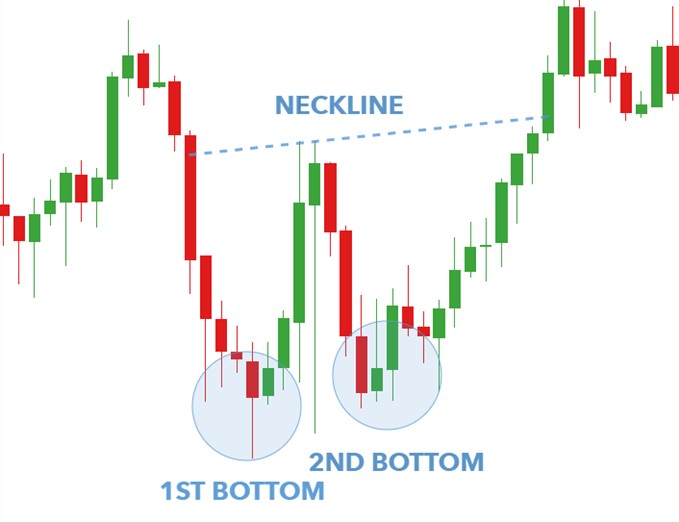 |
| Cup and Handle | This pattern comprises a rounded bottom, stability time, and a small rise. It means that the stock price is likely to keep going up. | 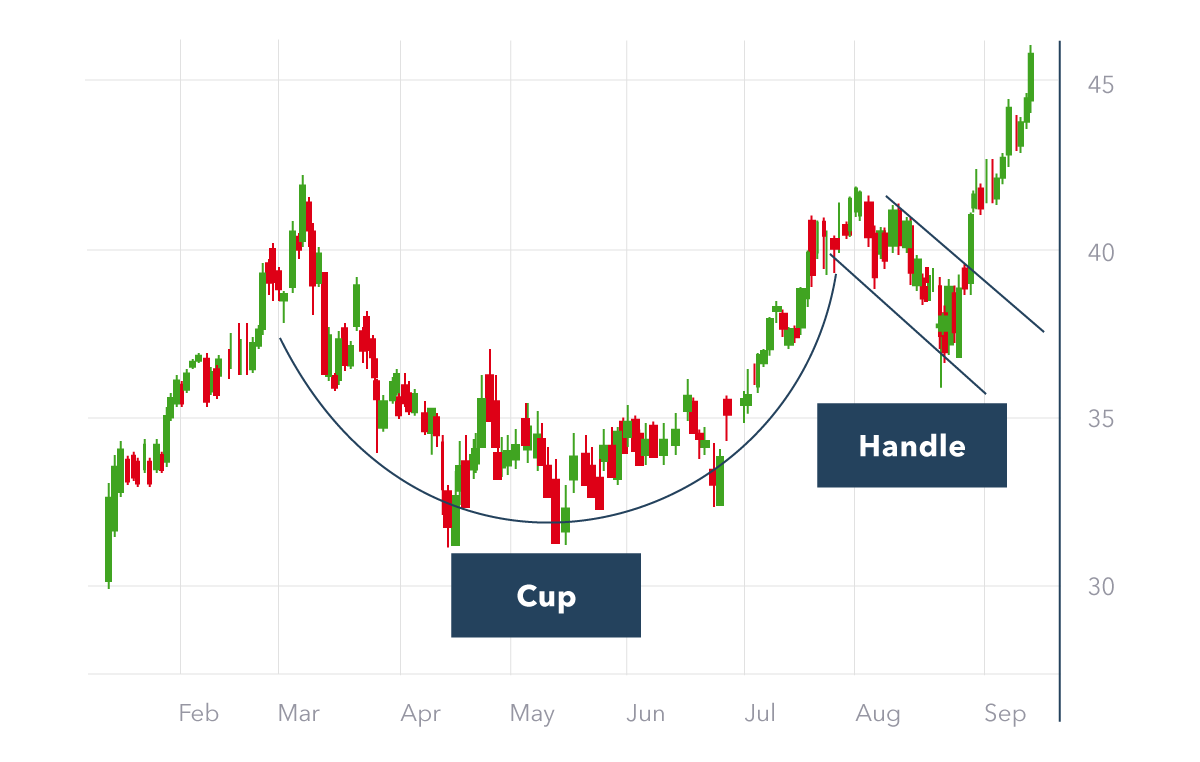 |
| Triangle | This chart pattern is formed when the price of a stock makes a series of lower highs and higher lows, forming a triangle shape. This pattern can be either bullish or bearish, depending on the direction of the breakout. | 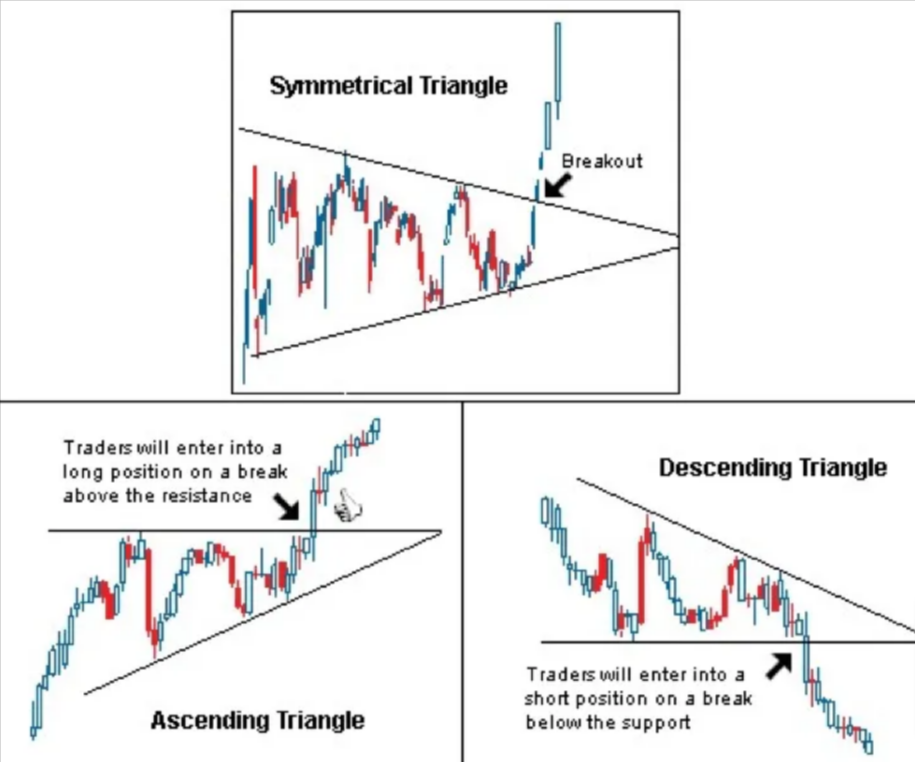 |
| Flag and Pennant | These patterns are similar to triangles in that they represent a period of consolidation before a continuation of the trend. A flag pattern is formed when the consolidation period is rectangular, while a pennant pattern is formed when the consolidation period is triangular. | 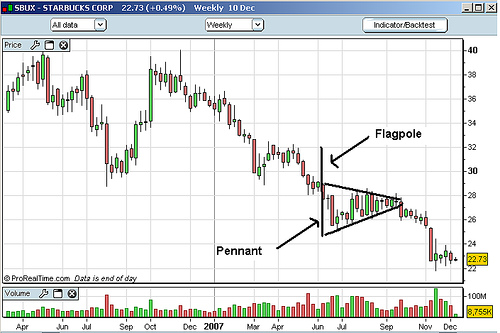 |
How to Analyze Share Market Chart Patterns?
Analyzing share market chart patterns is important in studying past market data to identify potential future trends. To analyze share market chart trends, follow these steps:- The first step is identifying the chart pattern you're looking at. As stated, there are many chart patterns, each with its traits and consequences.
- After identifying the pattern, determine the trend. Is it a stabilization, rise, or downtrend?
- Before dealing with a chart pattern, check other technical and fundamental analyses. For example, if you see a head and shoulders pattern forming, you might also look at the volume levels and moving averages to confirm the trend.
- Set your entry and exit marks after identifying a chart pattern and confirming the trend. This means using the trend and analysis to buy and sell.
- Finally, managing your risk when trading based on chart patterns is important. This involves making stop-loss orders and taking profits when required.


 Easy & quick
Leave A Comment?