

Introduction
Identifying bull markets early is crucial for traders and investors aiming to participate in long-term wealth creation. Bull markets offer sustained upside, expanding participation, and improving confidence, but entering too late or without confirmation often leads to poor risk-reward outcomes.
Charts play a vital role in identifying the early stages of bull markets, while fundamentals help validate whether price strength is supported by economic and corporate reality. When price behaviour, volume, and broader fundamentals align, the probability of a durable bull trend increases significantly.
What Is a Bull Market?
A bull market refers to a prolonged period of rising prices in the financial markets, marked by optimism, strong participation, and expanding economic activity.
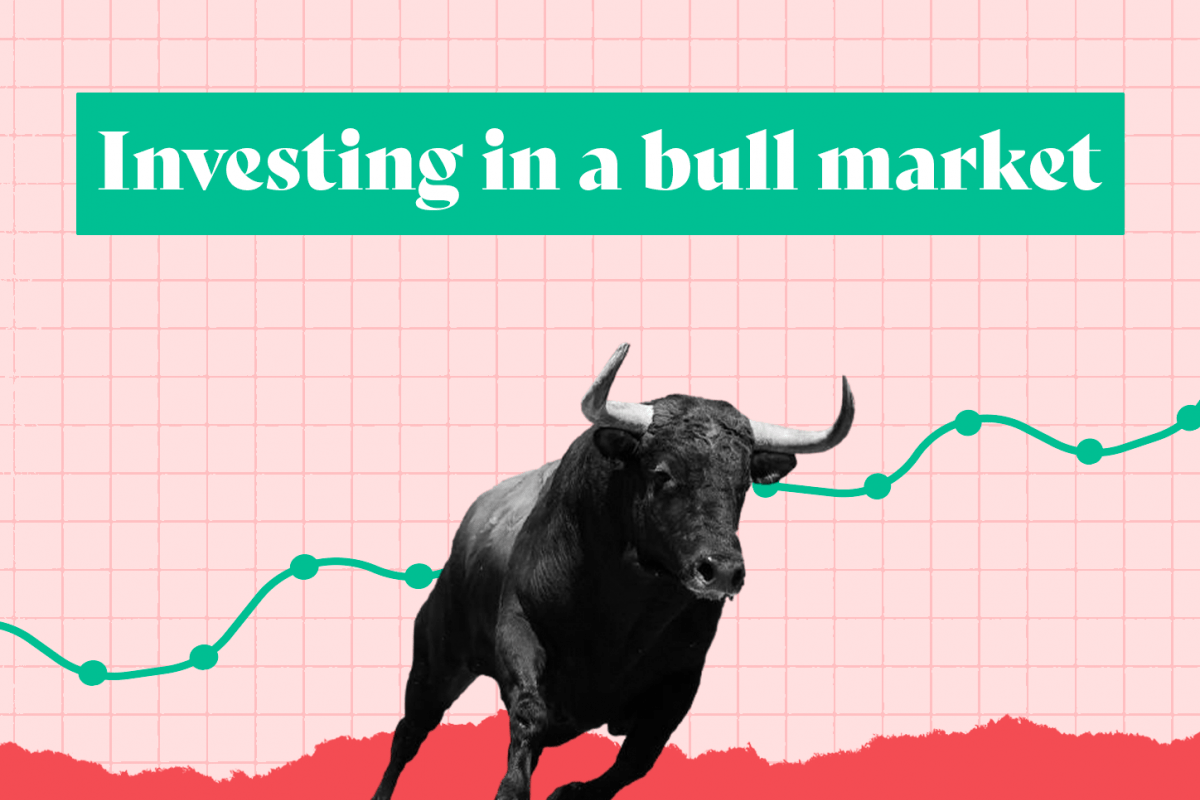
Bull Market Meaning (Simple Explanation)
In simple terms, a bull market means buyers dominate sellers, prices trend higher over time, and confidence gradually improves across market participants.
The 20 Percent Rule
A bull market is commonly said to begin when an index or stock rises 20 percent or more from its recent lows after a prolonged decline. This rule helps differentiate a genuine trend reversal from a short-term rally.
Bull Market vs Bear Market
- Bull market: Rising prices, higher highs and higher lows, positive sentiment
- Bear market: Falling prices, lower highs and lower lows, negative sentiment
Duration and Psychology
Bull markets typically last longer than bear markets. They evolve slowly, supported by improving fundamentals and expanding participation. Psychology shifts from scepticism to confidence and, eventually, optimism.
Phases of a Bull Market
Bull markets generally progress through three identifiable phases.
Accumulation Phase
Prices stabilise after a decline and move sideways. Smart money begins accumulating quietly while sentiment remains cautious.
Volume behaviour: Gradual increase during up-moves
Psychology: Disbelief and low confidence
Markup / Early Uptrend Phase
Prices break key resistance levels and form higher highs and higher lows. Participation widens as trends become visible.
Volume behaviour: Expansion on breakouts
Psychology: Confidence starts building
Euphoria / Peak Phase
Prices accelerate, valuations stretch, and participation peaks. Momentum dominates decision-making.
Volume behaviour: Extremely high activity
Psychology: Optimism and overconfidence
How to Identify a Bull Market Using Charts
- Price Structure Indicators
- Formation of higher highs and higher lows
- Breakout above major resistance levels
- Trendline breakouts confirming strength
These indicate sustained buying interest.
- Moving Averages
- Golden Cross: 50-day moving average crossing above the 200-day
- Price consistently holding above long-term averages
This confirms a long-term trend shift.
- Momentum Indicators
- RSI holding above 50, showing strength
- MACD crossing above signal line, indicating trend acceleration
Momentum confirms sustainability of price movement.
Bull Market Bottoms: How to Identify Reversal Zones
Bull markets begin at bottoms formed during pessimistic conditions.
- Types of Bottoms
V-Shaped Bottom
Sharp recovery after a steep fall, driven by strong buying urgency.
U-Shaped Bottom
Gradual recovery after prolonged consolidation, reflecting steady accumulation.
Double Bottom
Two similar lows followed by a resistance breakout, indicating selling exhaustion.
Rounded Bottom
Slow transition from decline to uptrend, often seen in long-term reversals.
- Bottom Confirmation Signals
- Volume expansion during up-moves
- Formation of higher lows
- Bullish divergence between price and momentum
- Breakout from a base or consolidation range
Confirmation matters more than anticipation.
Important Chart Patterns That Signal Bull Markets
Cup and Handle
Represents consolidation after a prior up-move. Breakout from the handle confirms trend continuation.
Ascending Triangle
Higher lows with flat resistance. Breakout signals accumulation pressure.
Inverse Head and Shoulders
Classic reversal pattern indicating the end of a downtrend.
Flag and Pennant
Short consolidation after a sharp rally, usually followed by continuation.
Rounding Bottom
Gradual transition from bearish to bullish conditions, often seen in long-term trends.
Each pattern reflects growing demand and improving confidence.
Fundamental Signals That Support a Bull Market
Charts gain strength when fundamentals align.
- Corporate earnings growth: Indicates improving profitability
- High liquidity: Supports risk-taking
- Lower interest rates: Encourage investment
- Strong GDP data: Reflects economic expansion
- Positive sentiment: Sustains participation
Fundamentals help validate whether price trends are sustainable.
Trader Psychology in Bull Markets
Bull markets are driven by psychology as much as price.
- Accumulation by informed participants
- Gradual confidence building
- Broadening participation across sectors
Volume expands as more participants join the trend.
Practical Example
Consider a market that forms a double bottom after a prolonged decline. Price breaks above resistance, volume expands, and the 50-day moving average crosses above the 200-day. RSI holds above 50, confirming momentum. Together, these signals validate the beginning of a bull market.
How Traders Can Use Bull Market Identification
- Avoid entering near euphoric peaks
- Look for pullbacks within uptrends
- Place stop-losses below higher lows
- Use disciplined position sizing
- Avoid emotional buying
Structure and patience matter.
Common Mistakes Traders Make in Bull Markets
- Chasing momentum too late
- Overconfidence during strong rallies
- Ignoring early reversal signs
- Confusing short-term rallies with long-term bull markets
Awareness reduces risk.
FAQs
What is a bull market?
A prolonged period of rising prices and positive sentiment.
What causes a bull market?
Improving fundamentals, liquidity, and confidence.
How long does a bull market last?
Typically longer than bear markets, often several years.
What is the difference between bull and bear markets?
Bull markets rise; bear markets decline.
Can traders lose money in a bull market?
Yes, due to poor timing, overconfidence, or lack of discipline.
Conclusion
Bull markets offer significant opportunities, but only for those who recognise them early and act with discipline. Combining chart patterns, confirmation signals, and fundamentals helps traders differentiate genuine trends from temporary rallies.
Identifying bull markets is not about prediction, it is about confirmation, patience, and disciplined execution.


 Easy & quick
Leave A Comment?