Introduction to Stochastic Indicator
The speed of market is not uniform. At times the speed is slow or some other times it is fast. However contemporary evidence suggests that during up moves the initial movement is fast and then later the velocity slows down before the eventual down turn. This momentum or the speed of the market is captured by Stochastic. This is an important indicator which portrays two things, one whether the trend is strong or whether the trend is maturing and beginning to weaken. This is an important indicator in the study of technical analysis in the arsenal of the traders.Stochastic Meaning
The Stochastic Oscillator, developed by George Lane, compares a security’s closing price level to its price range over a specific period of time. With this indicator, Lane theorized, in an upward-trending market, asset prices tend to close near their highs, and during a downward-trending market, asset prices tend to close near their lows. As an upward trend matures, prices tend to close further away from their high, and as a downward trend matures, asset prices tend to close away from their low. This Stochastic displays the strength or momentum of the trend. It helps in identifying turning points or reversals in the trend.Slow and Fast stochastic also known as %D Slow Stochastic and %K as Fast Stochastic:
The Stochastic Indicator is plotted as two lines, the %D line i.e Slow Stochastic and %K Line i.e. Fast Stochastic. The %D Line is more important than the %K Line. The stochastic indicator is plotted on a line chart with values ranging from 0 to 100. The value can never fall below 0 or go above 100. Readings above 80 are considered strong and indicate price is closing near its high and therefore overbought conditions. Readings below 20 are strong and indicate a price is closing near its low and therefore oversold conditions. Ordinarily, the %K line will change direction before the %D line. However, when the %D line changes direction prior to the %K line, a slow and steady reversal is indicated. A powerful move is under way when the indicator reaches its extremes around 0 and 100. Buy signal can be generated with %K crosses above the %D and sell signal can be generated when %K crosses below %D. Usual periods selected are 14 for the %K (Fast period), 3 for the %K (Full period) and 3 for the %D (Full period). [caption id="attachment_1539" align="aligncenter" width="1305"]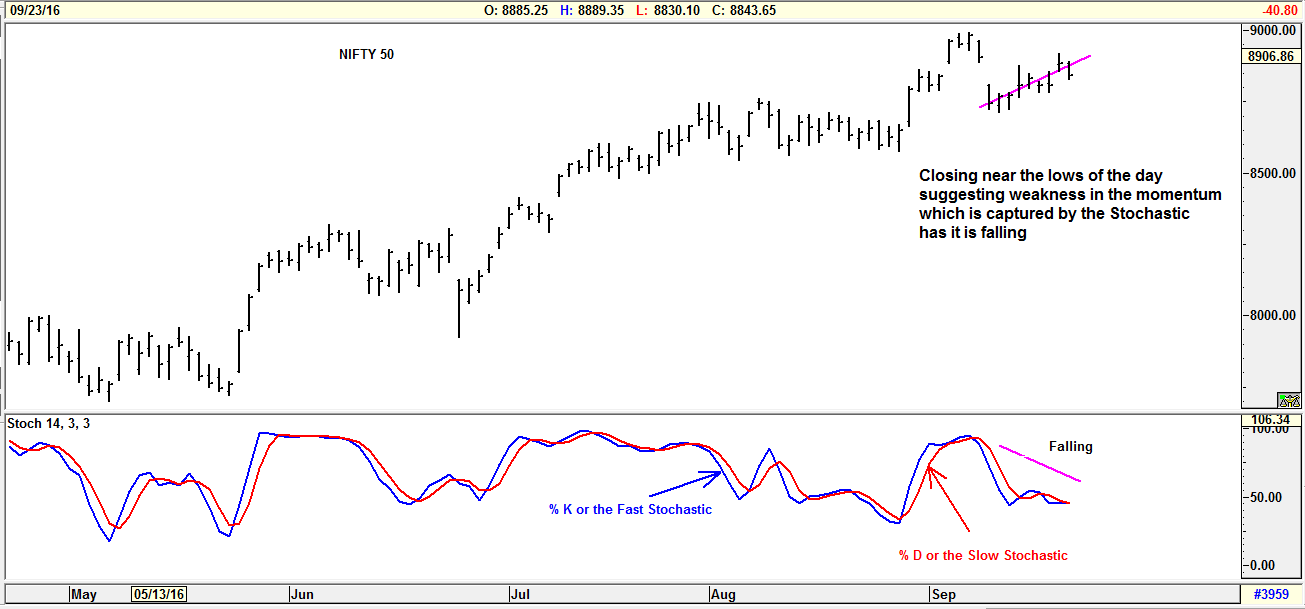 Stochastic Indicator Eg. NIFTY[/caption]
Use of Stochastic in Commodities
For commodities, the number of periods to use in stochastic is based on the cycle of the commodity being traded. First, determine the cycle of the commodity, then use the number of bars for stochastic corresponding to one half of the period of the cycle. If an 18-day cycle is observed, 9-day stochastic is used. Shorter term stochastic should be used to fine-tune an entry or exit at the point of decision. However, the analyst should immediately revert back to the optimum stochastic and be certain to trade with the trend.Interpreting Divergence in Stochastic
Quite often Divergence appears on the chart. The price may be making higher highs, but the Stochastic Oscillators are making lower lows in divergence to the prices. Or, conversely, price may be making lowers highs, and Stochastic Oscillator is making higher highs. In either case, the indicator is often demonstrating a change in price before price itself is changing. In an up trending market, many congested Tops, often Double Tops or Triple Tops can take several time periods to turn down and approach the bottom trendline. When prices finally do turn down, they often bottom quickly and turn right back up again, creating “Spike Bottoms.” These are to be expected in an up trending market. Knowledge of them can be helpful in strong trending markets.The Incorrect Myths of Stochastic
A misunderstanding some stochastic analysts have referred to the %K reaching the extremes of 100% or 0%. When the %K line reaches 100%, it does not mean that the prices can’t go higher. Conversely, even though the %K is at zero, prices can still go lower. Zero is not necessarily a Bottom, in fact, the opposite could be true. The extremes denote strength at the 100% or 0% level. The misunderstanding comes from levels commonly believed to indicate “overbought” or “oversold” when the %K and %D lines rise above 75%, it is considered an overbought situation or conversely, if they drop below 25%, it is considered oversold this is not true for Stochastic. When the move is a sustained move, the price decline can continue for an extended period, with the oscillator remaining near the bottom. [caption id="attachment_1540" align="aligncenter" width="1307"]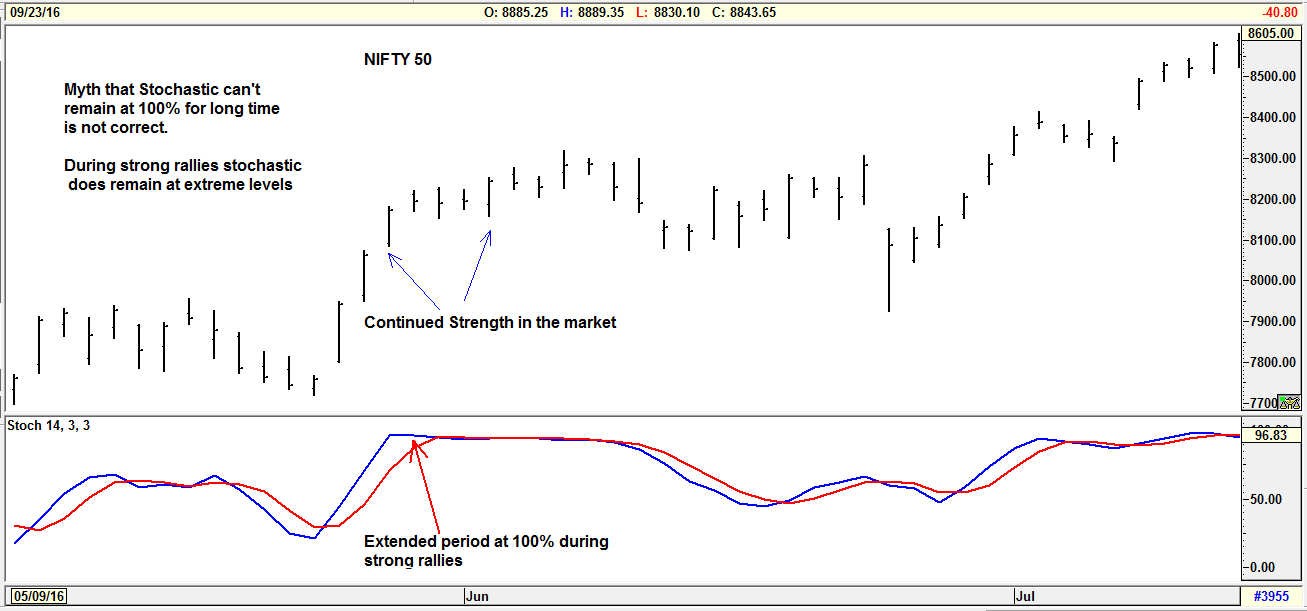 Myths about Stochastic indicator[/caption]
Conclusion: Indicators are very powerful but they have to be used in the proper context without which the utility of the indicator diminishes. However just like any other indicator stochastic has to be used with other confirming signals like trend line penetrations or price pattern breakouts for more reliable high probability trades.
Additional reference links
Myths about Stochastic indicator[/caption]
Conclusion: Indicators are very powerful but they have to be used in the proper context without which the utility of the indicator diminishes. However just like any other indicator stochastic has to be used with other confirming signals like trend line penetrations or price pattern breakouts for more reliable high probability trades.
Additional reference links


 Easy & quick
Leave A Comment?