

Every investor wants to find quality stocks before they become multibaggers. However, successful investing is not about following market tips, social media recommendations, or short-term price movements. It begins with understanding the business behind the stock.
This is where fundamental analysis plays a crucial role.
Fundamental analysis helps investors evaluate a company’s financial health, business model, competitive position, management quality, and future growth prospects. By analyzing these factors, investors can determine whether a stock is worth investing in and whether it is trading at a reasonable valuation.
In this guide, you’ll learn a practical framework to analyze stocks using fundamental analysis before making any investment decision.
What is Fundamental Analysis?
Fundamental analysis is the process of evaluating a company’s intrinsic value by studying its financial statements, business operations, industry trends, management quality, and valuation metrics.
The goal is to answer one simple question:
“Is this company fundamentally strong enough to invest in?”
Instead of focusing on short-term price fluctuations, fundamental analysis helps investors understand the long-term potential of a business.
Recommended Reading: Basics of Fundamental Analysis
Why Should Investors Analyze Stocks Before Investing?
Stock prices often move due to market sentiment, news, and speculation. However, long-term returns are generally driven by:
- Revenue growth
- Profitability
- Cash flow generation
- Efficient management
- Competitive advantages
- Industry growth
Analyzing stocks fundamentally helps investors:
✔ Make informed investment decisions
✔ Identify quality businesses
✔ Avoid fundamentally weak companies
✔ Reduce investment risks
✔ Build long-term wealth
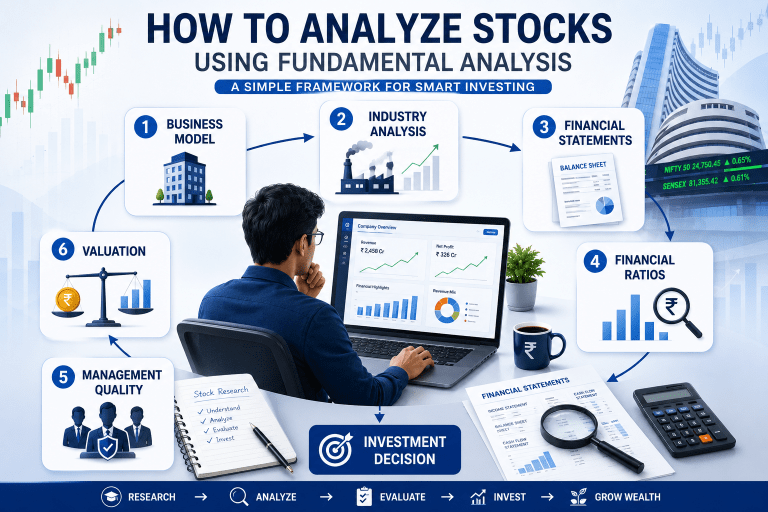
The 7-Step Framework to Analyze Stocks Using Fundamental Analysis
Step 1: Understand the Company’s Business Model
Before looking at financial statements or stock prices, understand how the company operates.
Ask yourself:
- What products or services does the company offer?
- How does it generate revenue?
- Who are its customers?
- What problem does it solve?
- Does the business have a competitive advantage?
Example
A company selling subscription-based software earns recurring revenue, while a steel manufacturer depends heavily on commodity cycles. Understanding these differences helps investors evaluate business sustainability.
Key Areas to Analyze
- Revenue sources
- Customer base
- Product portfolio
- Market position
- Competitive advantages
- Future growth opportunities
If you cannot clearly explain how a company makes money, it may be worth researching further before investing.
Step 2: Evaluate the Industry and Market Opportunity
Even a strong company may struggle if it operates in a declining industry.
Industry analysis helps investors understand:
- Industry growth potential
- Demand drivers
- Market size
- Regulatory environment
- Competitive landscape
- Future opportunities
Questions Investors Should Ask
- Is the industry growing?
- Who are the major competitors?
- Are there significant entry barriers?
- Is demand likely to increase in the future?
Examples of Growth-Oriented Sectors
- Financial Services
- Renewable Energy
- Digital Technology
- Pharmaceuticals
- Consumer Goods
- Manufacturing and Infrastructure
Companies operating in growing industries often enjoy stronger long-term earnings potential.
Step 3: Analyze Financial Statements
Financial statements provide insights into the company’s actual performance.
Every investor should understand three important financial statements:
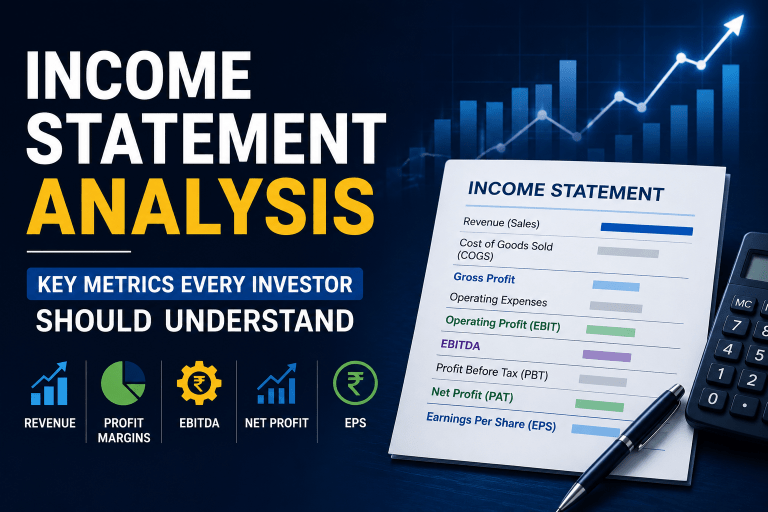
Income Statement
The income statement shows:
- Revenue
- Expenses
- Operating Profit
- Net Profit
What to Check
✔ Revenue growth over multiple years
✔ Profit growth consistency
✔ Operating margin trends
✔ Earnings stability
A business that consistently increases both revenue and profits often demonstrates operational strength.
Related Reading: How to Read an Income Statement
Balance Sheet
The balance sheet shows:
- Assets
- Liabilities
- Shareholders’ Equity
What to Check
✔ Debt levels
✔ Cash reserves
✔ Net worth
✔ Working capital position
Companies with strong balance sheets generally have better financial flexibility during difficult economic conditions.
Related Reading: Balance Sheet Analysis for Beginners
Cash Flow Statement
Profits do not always translate into actual cash generation.
The cash flow statement shows:
- Operating Cash Flow
- Investing Cash Flow
- Financing Cash Flow
What to Check
✔ Positive operating cash flow
✔ Consistent free cash flow generation
✔ Cash flow growth trends
Strong cash flow often indicates a healthy and sustainable business.
Related Reading: Cash Flow Statement Explained
Step 4: Evaluate Key Financial Ratios
Financial ratios simplify company comparison and help investors identify strengths and weaknesses.
Profitability Ratios
Return on Equity (ROE)
Measures how efficiently a company generates profits from shareholders’ funds.
Return on Capital Employed (ROCE)
Measures how effectively management utilizes total capital.
Net Profit Margin
Shows how much profit remains after all expenses.
Generally Preferred
- ROE above industry average
- ROCE above industry average
- Consistent profit margins
Valuation Ratios
Price-to-Earnings Ratio (P/E Ratio)
Measures how much investors are willing to pay for every rupee of earnings.
Price-to-Book Ratio (P/B Ratio)
Compares market value with book value.
PEG Ratio
Adjusts valuation based on earnings growth.
Valuation ratios should always be compared with industry peers rather than interpreted in isolation.
Financial Health Ratios
Debt-to-Equity Ratio
Measures financial leverage.
Lower debt generally indicates lower financial risk.
Interest Coverage Ratio
Measures the company’s ability to service debt obligations.
Higher coverage ratios indicate stronger financial stability.
Liquidity Ratios
Current Ratio
Measures short-term liquidity.
Quick Ratio
Measures immediate liquidity strength.
Companies with adequate liquidity can better manage operational challenges.
Step 5: Assess Management Quality and Corporate Governance
Strong businesses often have strong leadership.
Management quality significantly influences long-term shareholder returns.
Factors to Evaluate
Promoter Holding
Higher promoter ownership may indicate confidence in the business.
Corporate Governance
Look for:
- Transparent disclosures
- Ethical business practices
- Consistent communication
Capital Allocation
Good management deploys capital efficiently through:
- Expansion initiatives
- Debt reduction
- Dividends
- Share buybacks
Promoter Pledging
High promoter pledging can be a warning sign and deserves closer scrutiny.
Step 6: Analyze Growth Metrics
Investors should study historical growth trends.
Revenue Growth
Indicates demand expansion.
Profit Growth
Reflects business scalability and efficiency.
Earnings Per Share (EPS) Growth
Measures growth on a per-share basis.
Free Cash Flow Growth
Demonstrates increasing business strength.
Questions to Ask
- Has revenue grown consistently?
- Are profits growing faster than sales?
- Is EPS increasing steadily?
- Is cash flow improving?
Consistent growth often reflects strong business fundamentals.
Step 7: Determine Whether the Stock Is Fairly Valued
A great company is not always a great investment if purchased at an excessive price.
Investors should estimate a company’s intrinsic value before investing.
Common Valuation Methods
Relative Valuation
Compare the company with industry peers using:
- P/E Ratio
- P/B Ratio
- EV/EBITDA
Discounted Cash Flow (DCF)
Estimates the present value of future cash flows.
Margin of Safety
Investors often seek a discount between intrinsic value and market price to reduce investment risk.
The objective is to determine whether the stock is:
- Undervalued
- Fairly Valued
- Overvalued
Fundamental Analysis Checklist Before Buying Any Stock
Use this quick checklist before investing:
Business Quality
☐ Understandable business model
☐ Sustainable competitive advantage
☐ Strong industry position
Financial Strength
☐ Consistent revenue growth
☐ Increasing profits
☐ Positive operating cash flow
☐ Manageable debt
Management Assessment
☐ Trustworthy management
☐ Strong governance practices
☐ Sensible capital allocation
Valuation Review
☐ Reasonable valuation
☐ Attractive risk-reward profile
☐ Margin of safety available
If most boxes are checked, the company may deserve deeper research.
Common Mistakes Investors Make While Analyzing Stocks
Looking Only at P/E Ratio
A low P/E ratio alone does not make a stock attractive.
Ignoring Cash Flows
Profits without cash generation can indicate underlying issues.
Overlooking Debt Levels
Excessive debt can increase financial risk.
Following Market Tips
Investment decisions should be based on research, not rumors.
Ignoring Industry Trends
Industry growth often influences future earnings potential.
Buying Without Understanding the Business
Investors should know how the company generates revenue before investing.
Tools and Resources for Fundamental Analysis
Investors commonly use:
Company Documents
- Annual Reports
- Quarterly Results
- Investor Presentations
- Earnings Call Transcripts
Market Information Sources
- Stock Exchange Filings
- Regulatory Disclosures
- Industry Reports
- Company Announcements
Educational Resources
The Samco Knowledge Center offers guides covering:
- Fundamental Analysis
- Financial Statements
- Valuation Ratios
- Stock Market Basics
- Investment Strategies
These resources can help investors build a structured approach to stock analysis.
Frequently Asked Questions
How do beginners analyze stocks using fundamental analysis?
Beginners should start by understanding the business model, reviewing financial statements, analyzing key ratios, assessing management quality, and evaluating valuation before investing.
Which financial ratio is most important for stock analysis?
There is no single most important ratio. Investors typically analyze ROE, ROCE, P/E Ratio, Debt-to-Equity Ratio, and Cash Flow metrics together.
How often should investors perform fundamental analysis?
Investors should review company fundamentals after quarterly earnings announcements and conduct a detailed review annually.
Can fundamental analysis predict stock prices?
Fundamental analysis helps estimate a company’s intrinsic value but cannot accurately predict short-term price movements.
Is fundamental analysis suitable for long-term investing?
Yes. Fundamental analysis is widely used by long-term investors to identify quality businesses with sustainable growth potential.
Conclusion
Fundamental analysis is one of the most effective methods for evaluating stocks and making informed investment decisions. By understanding a company’s business model, financial statements, industry position, management quality, growth prospects, and valuation, investors can identify fundamentally strong businesses and avoid costly mistakes.
Rather than relying on market noise or short-term price movements, a disciplined approach to fundamental analysis enables investors to focus on business quality and long-term value creation. Following a structured framework can help investors build confidence, reduce risk, and make better investment decisions over time.