

When investors evaluate a company before investing, one of the first financial documents they examine is the income statement. Often called the Profit and Loss (P&L) Statement, it provides valuable insights into how much revenue a company generates, how efficiently it manages costs, and whether it is consistently profitable.
While many investors focus on stock prices, experienced investors focus on earnings. A company with strong and growing earnings is more likely to create long-term shareholder value than one whose stock price is rising solely due to market sentiment.
In this guide, we’ll explore the most important metrics investors should analyze in an income statement and how these numbers can help assess a company’s financial performance.
What Is an Income Statement?
An income statement is a financial report that summarizes a company’s revenues, expenses, and profits over a specific period, such as a quarter or financial year.
It answers three critical questions:
- Is the company growing its sales?
- Is the business profitable?
- Are profits improving over time?
By analyzing these factors, investors can gain a clearer understanding of a company’s operational efficiency and long-term growth potential.
Why Income Statement Analysis Matters
Income statement analysis helps investors:
✔ Evaluate business growth
✔ Measure profitability trends
✔ Compare companies within the same industry
✔ Assess management efficiency
✔ Identify financial red flags
✔ Make informed investment decisions
A company may appear attractive on the surface, but its income statement often reveals whether the business is genuinely creating value for shareholders.
Understanding the Structure of an Income Statement
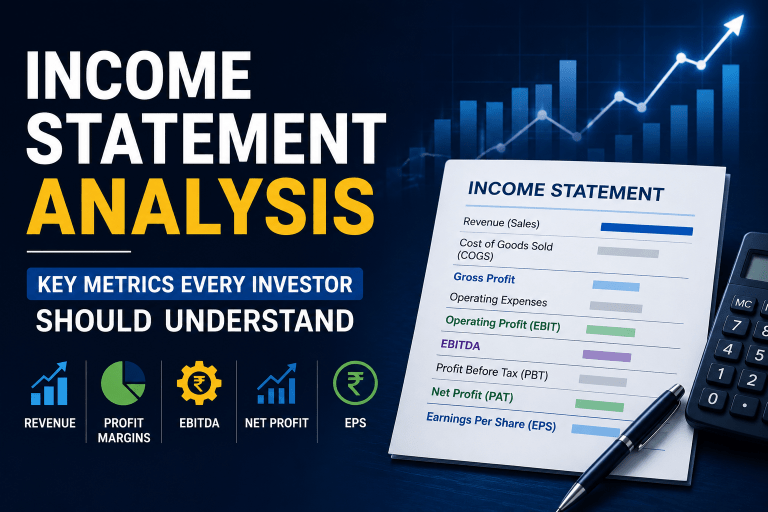
A typical income statement follows this sequence:
Revenue
↓
Gross Profit
↓
Operating Profit (EBIT)
↓
EBITDA
↓
Profit Before Tax (PBT)
↓
Net Profit (PAT)
↓
Earnings Per Share (EPS)
Each metric tells a different story about the company’s financial performance.
Key Metrics Every Investor Should Analyze
1. Revenue (Sales)
Revenue is the total income generated from selling products or services before deducting expenses.
It is often called the Top Line because it appears at the top of the income statement.
Why Revenue Matters
Revenue growth indicates increasing customer demand and business expansion.
For example:
| Financial Year | Revenue |
|---|---|
| FY23 | ₹8,000 Cr |
| FY24 | ₹9,200 Cr |
| FY25 | ₹10,500 Cr |
Steady revenue growth over several years is generally considered a positive sign.
What Investors Should Look For
- Consistent growth over multiple years
- Higher growth than industry averages
- Diversified revenue sources
- Sustainable business demand
2. Gross Profit
Gross Profit represents earnings remaining after deducting direct production costs.
Formula
Gross Profit = Revenue – Cost of Goods Sold (COGS)
Why Gross Profit Matters
It reflects the company’s ability to generate profits from its core products and services.
Higher gross profits often indicate:
- Strong pricing power
- Efficient production
- Better cost management
Investors should monitor gross profit trends over time rather than reviewing a single year’s figures.
3. Gross Profit Margin
Gross Profit Margin measures profitability after accounting for production costs.
Formula
Gross Profit Margin=Gross ProfitRevenue×100Gross\ Profit\ Margin = \frac{Gross\ Profit}{Revenue}\times100
Example
Revenue = ₹1,000 Cr
Gross Profit = ₹400 Cr
Gross Margin = 40%
Why It Matters
A stable or improving gross margin often indicates operational strength and pricing flexibility.
4. EBITDA
EBITDA stands for:
Earnings Before Interest, Taxes, Depreciation and Amortization
EBITDA focuses on the profitability of the company’s core operations by excluding financing and accounting-related expenses.
Why Investors Analyze EBITDA
EBITDA helps:
- Compare companies objectively
- Assess operational efficiency
- Evaluate business performance independent of capital structure
Companies with rising EBITDA generally demonstrate improving operational performance.
5. EBITDA Margin
EBITDA Margin measures operating profitability relative to revenue.
Formula
EBITDA Margin=EBITDARevenue×100EBITDA\ Margin = \frac{EBITDA}{Revenue}\times100
Why It Matters
A growing EBITDA margin may indicate:
- Improved operational efficiency
- Better cost management
-
Enhanced business scalability
6. Operating Profit (EBIT)
Operating Profit, also known as EBIT (Earnings Before Interest and Taxes), measures profitability generated from core business activities.
Formula
Operating Profit = Gross Profit – Operating Expenses
Why Investors Monitor EBIT
Operating profit shows whether the company’s primary business operations are profitable without considering financing decisions.
Strong operating profit often reflects:
✔ Efficient operations
✔ Effective cost control
✔ Sustainable business performance
7. Operating Profit Margin
Operating Margin measures operating profitability as a percentage of revenue.
Formula
Operating Margin=Operating ProfitRevenue×100Operating\ Margin = \frac{Operating\ Profit}{Revenue}\times100
What It Reveals
Higher operating margins often indicate:
- Competitive advantages
- Operational efficiency
- Better business quality
8. Profit Before Tax (PBT)
Profit Before Tax represents earnings before income taxes are deducted.
Why PBT Matters
PBT helps investors understand profitability without the impact of changing tax rates.
Comparing PBT growth across multiple years can reveal improvements in overall business performance.
9. Net Profit (PAT)
Net Profit, also called Profit After Tax (PAT), is the final profit remaining after all expenses, interest costs, and taxes have been deducted.
Why Net Profit Is Important
Net profit is one of the most widely followed indicators of company performance.
Growing net profits often suggest:
- Healthy business operations
- Strong demand
- Efficient management
Investors should focus on long-term profit trends rather than short-term fluctuations.
10. Net Profit Margin
Net Profit Margin measures overall profitability.
Formula
Net Profit Margin=Net ProfitRevenue×100Net\ Profit\ Margin = \frac{Net\ Profit}{Revenue}\times100
Why It Matters
Higher net margins generally indicate:
- Better profitability
- Greater financial flexibility
- Stronger earnings quality
11. Earnings Per Share (EPS)
EPS measures how much profit is attributable to each outstanding share.
Formula
EPS=Net ProfitOutstanding SharesEPS = \frac{Net\ Profit}{Outstanding\ Shares}
Example
Net Profit = ₹500 Cr
Outstanding Shares = 100 Cr
EPS = ₹5
Why EPS Matters
EPS is used to:
- Measure shareholder profitability
- Compare companies
- Calculate valuation metrics such as P/E Ratio
Consistently rising EPS often reflects improving shareholder value.
How to Analyze an Income Statement Like an Investor
Step 1: Examine Revenue Growth
Check whether sales are growing consistently over multiple years.
Questions to ask:
- Is revenue increasing every year?
- Is growth faster than competitors?
- Are revenues diversified?
Step 2: Study Profit Margins
Analyze:
- Gross Margin
- EBITDA Margin
- Operating Margin
- Net Margin
Healthy margins often indicate business strength.
Step 3: Compare Multi-Year Trends
Look beyond one quarter.
Review:
- 3–5 years of annual performance
- Quarterly earnings trends
- Historical profitability
Consistency matters more than temporary earnings spikes.
Step 4: Assess Cost Efficiency
Monitor whether:
- Expenses are growing faster than revenue
- Margins are expanding
- Operational efficiency is improving
Step 5: Evaluate EPS Growth
Companies that consistently grow EPS often create long-term shareholder value.
Income Statement Red Flags Investors Should Watch
Not all earnings growth is healthy.
Be cautious if you observe:
Declining Revenue
May indicate weakening demand.
Falling Margins
Can suggest increasing costs or pricing pressure.
Sharp Increase in Expenses
May reduce future profitability.
Heavy Dependence on Non-Operating Income
Profits should primarily come from core business activities.
Stagnant EPS
May indicate slowing shareholder value creation.
Inconsistent Earnings
Volatile profits often increase investment risk.
Income Statement Analysis Checklist
Before investing in a company, review:
☐ Revenue growing consistently
☐ Gross profit increasing
☐ EBITDA margin stable or improving
☐ Operating margin healthy
☐ Net profit growing
☐ EPS increasing
☐ Expenses under control
☐ Core business generating profits
☐ Margins stronger than industry average
☐ No major earnings red flags
Frequently Asked Questions
What is income statement analysis?
Income statement analysis is the process of evaluating a company’s revenue, expenses, profitability, and earnings trends to assess financial performance and investment potential.
Which metric is most important in an income statement?
There is no single most important metric. Investors generally analyze revenue growth, operating profit, net profit, profit margins, EBITDA, and EPS together.
Why is EPS important?
EPS indicates the profit earned per share and helps investors assess earnings growth and company valuation.
What is a good net profit margin?
A good net profit margin varies across industries. Investors should compare margins with industry peers rather than relying on fixed benchmarks.
Can income statement analysis alone determine whether a stock is good?
No. Investors should analyze the income statement alongside the balance sheet, cash flow statement, valuation metrics, and management quality.
Conclusion
Income statement analysis is one of the most important aspects of fundamental stock analysis. By understanding key metrics such as revenue, gross profit, EBITDA, operating profit, net profit, profit margins, and EPS, investors can evaluate a company’s financial performance more effectively.
Rather than focusing solely on stock price movements, successful investors examine earnings quality, profitability trends, and operational efficiency to identify fundamentally strong businesses capable of creating long-term value.