

Introduction
Identifying bear markets early is critical for both traders and investors. Bear markets can erode capital quickly, test emotional discipline, and distort long-term decision-making if not recognised in time. Unlike short-term market corrections, bear markets reflect a deeper shift in trend, sentiment, and participation.
For traders, bear markets often mean frequent false rallies, higher volatility, and lower probability setups. For investors, they can result in prolonged drawdowns and delayed recovery of portfolios. This makes early detection and proper interpretation essential.
Charts play a central role in identifying bear markets. Price trends, support breakdowns, volume behaviour, and market structure often signal stress well before economic data or news headlines confirm it. Understanding these visual cues helps market participants reduce risk, adjust strategy, and prepare for eventual recovery phases.
What Is a Bear Market?
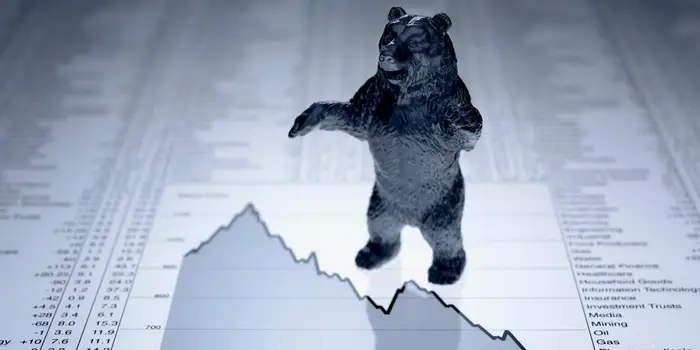
A bear market is generally defined as a sustained market decline of 20 percent or more from recent highs, accompanied by weakening sentiment, deteriorating market structure, and persistent selling pressure.
Bear Market Meaning in Simple Terms
A bear market reflects a phase where sellers dominate buyers, rallies fail to sustain, and confidence gradually erodes. Prices decline not due to a single event, but because underlying conditions weaken over time.
Bear Market vs Correction
- Correction: A short-term decline, usually 10–15 percent, within a broader uptrend
- Bear market: A prolonged downtrend marked by lower highs, lower lows, and failed recoveries
What a Bear Market Means for Traders
In bear markets, capital preservation becomes more important than aggressive return generation. Trend-following strategies shift to the downside, while counter-trend buying becomes riskier without confirmation.
Phases of a Bear Market
Bear markets tend to unfold in a recognisable sequence, driven by both price behaviour and investor psychology.
-
Distribution Phase – Smart Money Exits
After a prolonged uptrend, prices move sideways near highs. Volatility increases, leadership weakens, and institutions begin reducing exposure quietly.
Psychology: Optimism remains high, but informed participants turn cautious.
-
Downtrend Confirmation – Lower Highs and Lower Lows
Key support levels break, and rallies fail at lower levels. This phase confirms that the trend has shifted.
Volume behaviour: Selling volume expands, while recovery attempts show weaker participation.
-
Panic Phase – Sharp Sell-Offs
News flow turns negative, volatility spikes, and prices fall rapidly. Emotion overrides logic.
Psychology: Fear dominates as traders rush to exit positions.
-
Capitulation – Extreme Negative Sentiment
Selling becomes indiscriminate. High volume reflects exhaustion as weaker hands exit.
Psychology: Maximum pessimism, widespread disbelief in recovery.
-
Bottoming Phase – Sideways Structure and Accumulation
Prices stabilise and move sideways. Volatility reduces, and selective buying emerges.
Psychology: Indifference replaces fear, setting the stage for recovery.
- Chart Patterns That Help Identify Bear Markets
- Breakdown from Major Support Levels
A decisive break below long-term support often marks the beginning of a bear market. Failed retests reinforce bearish control.
Trader reaction: Shift from buying dips to selling rallies.
- Lower Highs and Lower Lows Trend Structure
This is the strongest visual confirmation of a bear market. Each rally peaks lower than the previous one, and each decline pushes to new lows.
Recognition: Trendlines slope downward, and recovery attempts lose strength.
- Descending Triangle Breakdown
Repeated failures at resistance combined with weakening support indicate mounting selling pressure.
Volume pattern: Declining volume during consolidation, followed by a spike on breakdown.
- Bear Flags and Bearish Pullbacks
A sharp fall followed by a shallow upward consolidation often signals continuation rather than reversal.
Key insight: These are pauses within a downtrend, not signs of strength.
- Death Cross and Moving Average Breakdown
When the 50-day moving average crosses below the 200-day average, it often confirms a long-term trend shift.
Implication: Longer-term participants reduce exposure.
- Volume Analysis in Bear Markets
- High volume on down days signals institutional selling
- Low volume on pullbacks suggests weak buying interest
Volume confirms trend strength.
How to Identify Bear Market Bottoms
Bear market bottoms form through a process, not a single candle.
- Characteristics of Bottom Formation
- Exhaustion selling
- Sharp volume spikes
- Reversal candles such as hammer or bullish engulfing patterns
- Stabilisation above short-term averages
- Accumulation Signs
- Sideways movement after steep declines
- Formation of higher lows
- Sector rotation into resilient or emerging leaders
- Sentiment Indicators
- Panic-driven news cycles
- Weak earnings already priced in
- Retail capitulation
Bear market bottoms often emerge when sentiment is most negative.
- Confirmation Signals
- Break above resistance zones
- Sustained closes above key moving averages
- Improving market breadth
Confirmation matters more than prediction.
Duration, Intensity and Market Behaviour
Bear markets vary in length and severity. Some last a few months, while others extend for years. Average declines often range between 30–50 percent, though sector-specific damage can be deeper.
Cyclical and leveraged sectors typically suffer larger declines, while defensive sectors show relative resilience. Understanding this variation helps in portfolio positioning.
How Traders Can Use This Information
- Avoid trying to catch falling markets
- Wait for confirmation before committing capital
- Use strict risk management
- Track relative sector strength
- Apply trailing stops cautiously during reversals
Bear markets reward patience and discipline.
Common Mistakes Traders Make in Bear Markets
- Buying too early based solely on price decline
- Ignoring trend structure
- Overconfidence during short rallies
- Neglecting volume confirmation
These mistakes often extend drawdowns.
Conclusion
Bear markets are not random events. They follow identifiable phases, chart patterns, and psychological cycles. Traders who understand market structure, volume behaviour, and sentiment shifts are better positioned to protect capital and prepare for recovery.
Recognising bear markets early and understanding how bottoms form enables disciplined, analytical decision-making, an essential skill in every market cycle.


 Easy & quick