Taki aap bane behtar trader


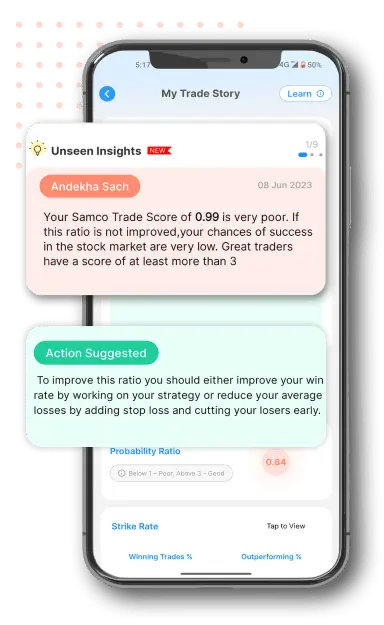

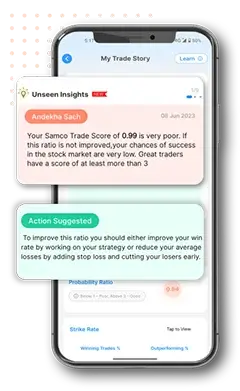
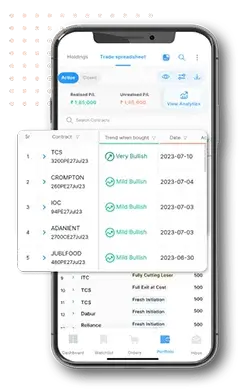
The Samco's unique engine analyzes your part trades & shows a hidden unseen insight from your past trade performance..Read more
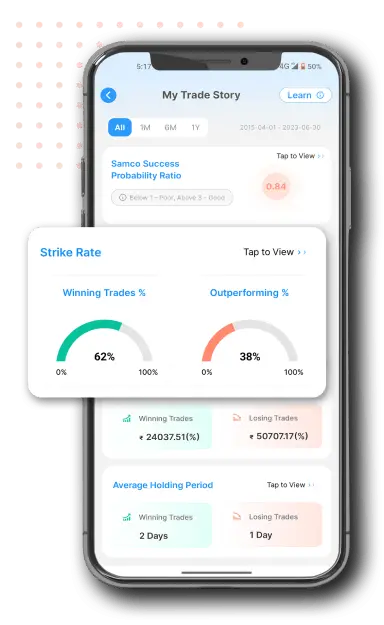
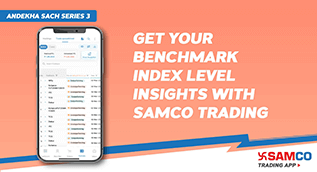
Get insights on your trade profits compared to your benchmark index profits..Read more
Get market sentiment insights compared to your trades on a real time basis..Read more
The Samco's unique engine analyzes your part trades & shows a hidden unseen insight from your past trade performance...Read more
Get insights on your trade profits compared to your benchmark index profits..Read more
Get market sentiment insights compared to your trades on a real time basis..Read more
The Samco's unique engine analyzes your part trades & shows a hidden unseen insight from your past trade performance...Read more
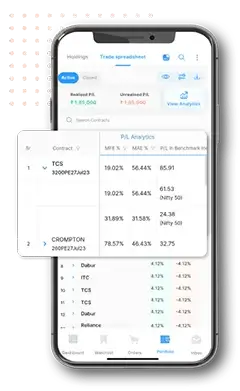
Get insights on your trade profits compared to your benchmark index profits..Read more

Get market sentiment insights compared to your trades on a real time basis..Read more
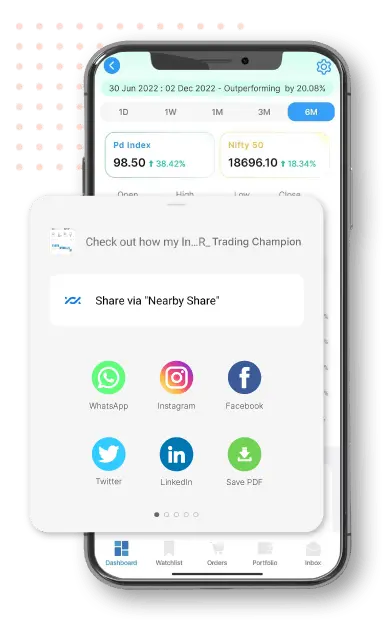
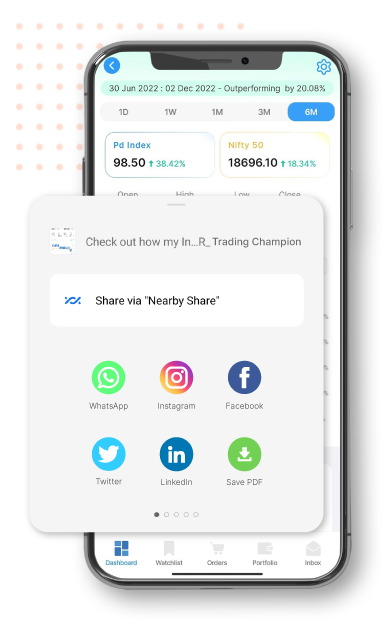
Compare your stock market performance to know your outperformance or underperformance..Read more
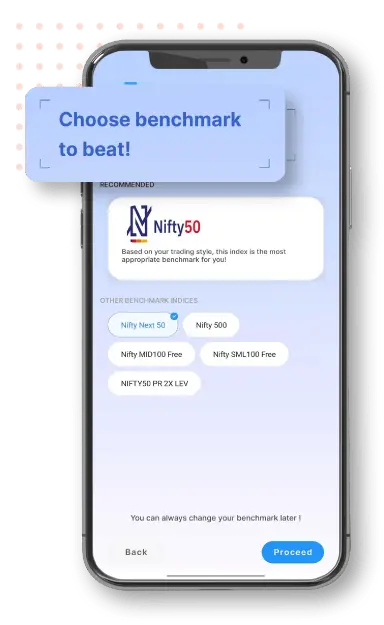
Track & compare your trading success with multiple benchmark indexes of your choice..Read more
Share your personal index outperformance with your friends & family with a verified certificate.
Compare your stock market performance to know your outperformance or underperformance..Read more

Track & compare your trading success with multiple benchmark indexes of your choice..Read more

Share your personal index outperformance with your friends & family with a verified certificate.
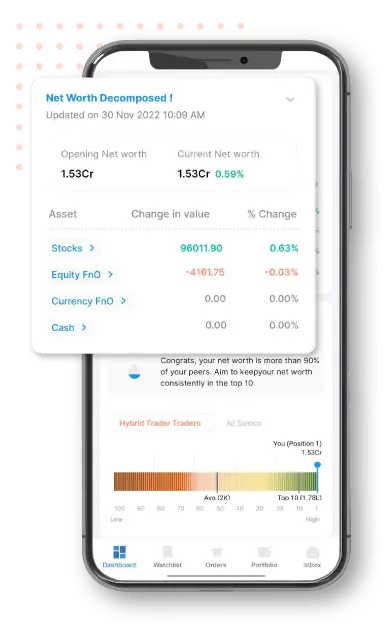
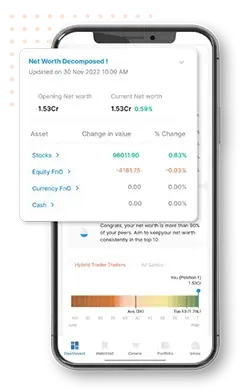
Track the movements of your net worth on a real time basis..Read more
Track the performance of your net worth and reallocate for better performance.
Share your net worth performance with your friends & family with a verified certificate.
Track the performance of your net worth and reallocate for better performance.

Share your net worth performance with your friends & family with a verified certificate.
Benchmark your performance against traders and investors..Read more
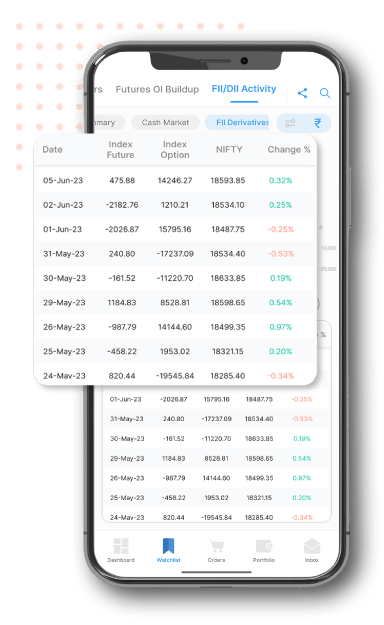
Get access to bulk block deals of FIIs & DIIs.
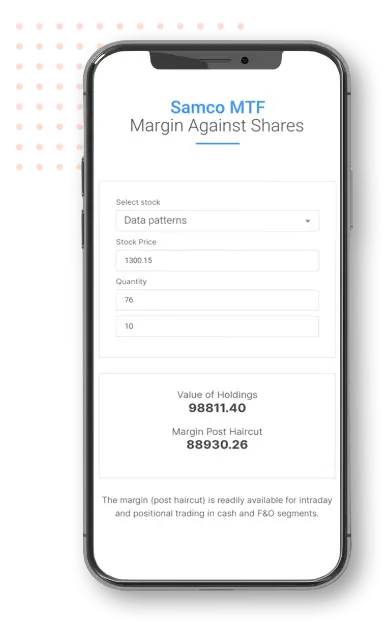
Get margin against your shares for your intraday and positional trades.
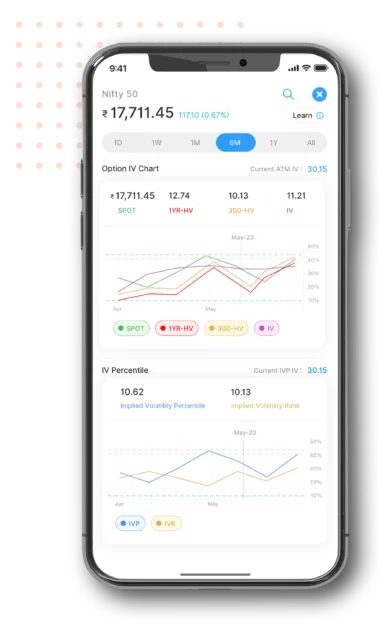
Now get live option greeks & IV charts for all option contracts on the Samco Trading App.
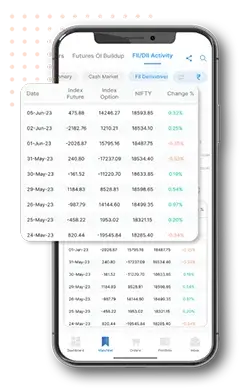
Get access to bulk block deals of FIIs & DIIs.

Get margin against your shares for your intraday and positional trades.
Now get live option greeks & IV charts for all option contracts on the Samco Trading App.

Jano Apne Hi Tajurbe ka Andekha Sach

Track your stock market performance with market

Measure your performance against top mutual fund managers

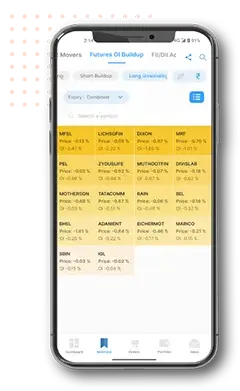
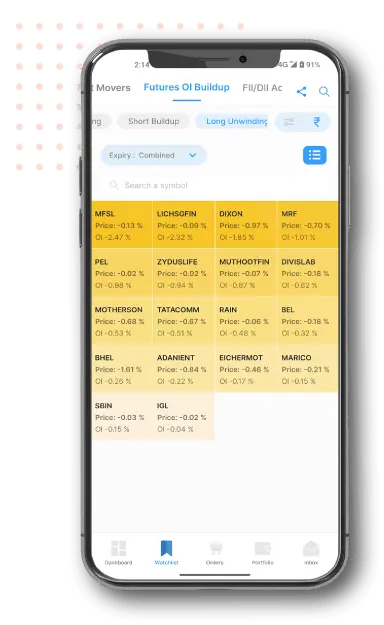
Get real time futures Open Interest build up heat maps

Get access to bulk block deals of FIIs & DIIs

Get trading opportunities with Market Movers

Pay only the exchange margins requirements

Enhance your equity delivery buying leverage

Get margin against your shares for your intraday and positional trades
Now get live option greeks & IV charts for all option contracts on the Samco Trading App
Get access to 50+ indicators, 16 chart layouts & unlimited saved charts with Samco app.


Get the link to download the app.

 Easy & quick
1. Register on SCORES portal
2. Mandatory details for filling complaints on SCORES
Name | PAN | Address | Mobile | Number | E-mail ID
3. Benefits
Effective Communication
Speedy redressal of the grievances